Category Archives: Network Notebook

Semi-structured notes on my Ph.D. thesis work on network science. For an intro, see http://youtu.be/KKrM2c-ww_k

Algorithmic detection of specialization in online conversations

This is a writeup of the Team 1 hackathon at Masters of Networks 2. Participants were: Benjamin Renoust, Khatuna Sandroshvili, Luca Mearelli, Federico Bo, Gaia Marcus, Kei Kreutler, Jonne Catshoek and myself. I promise you it was great fun!

The goal

We would like to learn whether groups of users in Edgeryders are self-organizing in specialized conversations, in which (a) people gravitate towards one or two topics, rather than spreading their participation effort across all topics, and (b) the people that gravitate towards a certain topic also gravitate towards each other.

Why is this relevant?

Understanding social network dynamics and learning to see the pattern of their infrastructure can become a useful tool for policy makers to rethink the way policies are developed and implemented. Furthermore, it could ensure that policies reflect both needs and possible solutions put forward by people themselves. The ability to decode linkages between members of social networks based on the areas of their specialization can allow decision makers and development organisations to:

  1. Tap into existing networks of knowledge and expertise to gain increased understanding of a policy issue and of the groups most affected (i.e. the target population of a policy)
  2. Identify pre-existing bottom-up (ideas for) solutions relevant to the policy issue at hand
  3. Bring together networks with a proven interest in a policy issue and leverage their engagement to design new solutions and bring about change

Compared to traditional models of policy development, this method can allow for more effective and accountable policy interventions. Rather than spending considerable resources on developing a knowledge base and building new communities around a policy theme, the methodology would enable decision makers and development organisations alike to tap into available knowledge bases and to work with these existing networks of interested specialists, saving time and resources. Moreover, pre-existing networks of specialists are expected to be more sustainable as a resource of information and collective action than ad-hoc networks built around emerging policy issues.

The data

Edgeryders is a project rolled out by the Council of Europe and the European Commission in late 2011. Its goal was to generate a proposal for the reform of European youth policy that encoded the point of view of youth themselves. This was done by launching an open conversation on an online platform (more information).

The conversation was hosted on a Drupal 6 platform. Using a Drupal module called Views Datasource, we exported three JSON files encoding respectively information about users; posts; and comments.
These data are sufficient to build the social network of the conversation. In it, users represent nodes; comments represent edges. Anna and Bob are connected by an edge if Anna has written at least one comment to a piece of content authored by Bob. We used a Python script with the Tulip library for network analysis to build the graph and analyze it. The result was a network with 260 active people and about 1600 directed edges, encoding about 4000 comments.

To move towards our goal, we needed to enrich this dataset with extra information concerning the semantics of that conversation (see below).

What we did

To define the extent to which degree people gravitate towards certain topics, and towards each other, we carried out “entanglement analysis” on a dataset containing all conversations carried out between members of the Edgeryders network. Entanglement analysis was proposed by Benjamin Renoust in 2013; we performed it using a program called Data Detangler (accessible at http://tulipposy.labri.fr:31497/).

1. Understanding Edgeryders as a social network of comments

These data can be interpreted as a social network: people write posts and comment on them; moreover, they can comment other people’s comments. Within this dataset, each comment can be interpreted as an edge, connecting the author of the comment to the author of the post or comment she is commenting on. Alternatively, we could interpret them as a bipartite network that connects people to content: comments are edges that connect their authors to the unit of content they are commenting.

2. Posts are written in response to briefs

Each of the posts written on Edgeryders is a response to set briefs, or missons, that sit under higher level campaigns. This means that many posts – and associated comments – live under the higher level ‘topic’ of one of nine campaigns.

3. Keywords indexing briefs

In order to understand how the various topics and briefs connect to each other we analysed the keywords that defined each mission/brief. This was carried out by manually analysing the significance of word frequency for each post. Word Frequency was ascertained by using the in-browser software http://tagcrowd.com/faq.html#whatis to work out the top 12-15 words per mission. We then manually verified these words and kept those that are semantically relevant (removing, for example names, or words that were too general, or that were a function of the Edgeryders platform itself- e.g. ‘comment’ or ‘add post’).

The combination of these three elements gives us a multiplex social network, that is indexed by keywords. A multiplex social network is one where there are multiple relations among the same set of actor. The process can be visualized in Figure 1.
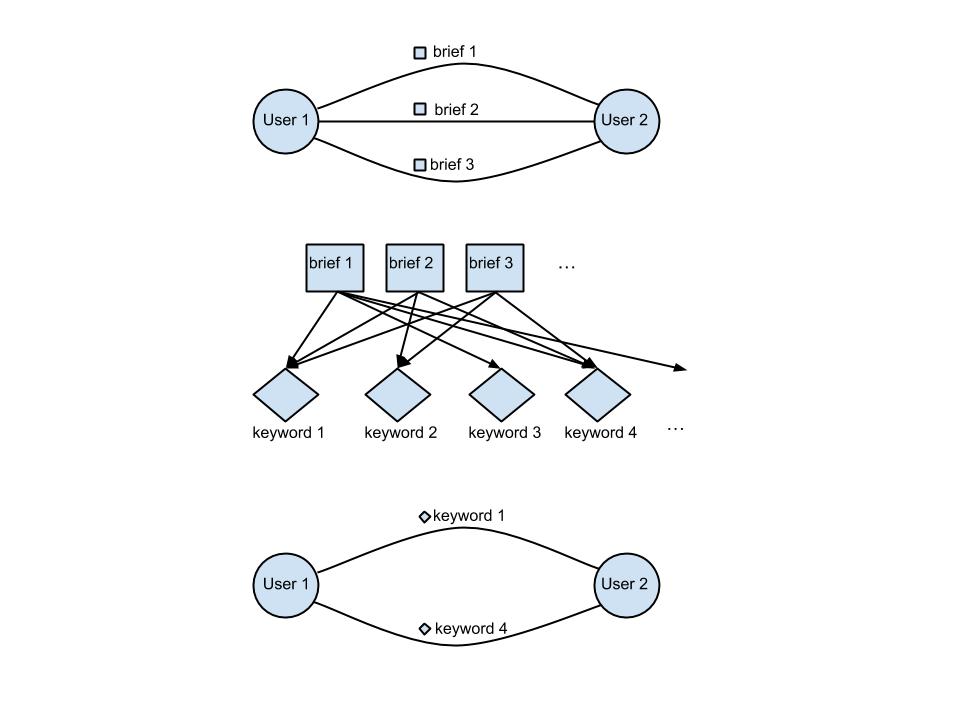
Fig. 1 – Building a multiplex  social network where edges carry semantics. Fig. 1 – Building a multiplex social network where edges carry semantics.

4. Drop one-off interactions

We dropped edges that are linked to only one brief. These are edges of  “degenerate specialistic” interactions; as they only interact in the context of one brief, they are specialistic only by default.

5. Remove generalist conversations

At this point, we had a multiplex social network of users and keywords. Users were connected by edges carrying different keywords – indeed, each keyword can be seen as a “layer” of the multiplex network, inducing its own social network: the network of the conversation about employment, the network of the conversation about education etc. Many of the interactions going on are non-specialized; the same two users talk of several different things. In order to isolate specialized conversation, for each individual edge of the multiplex we remove all keywords except those that appear in all interactions between these two users. In other words, we rebuild the network by assigning to each edge the intersection of the sets of keywords encoded in each of the individual interactions. In many cases, the intersection is empty: it only takes two interactions happening in the context of two briefs with no keywords in common for this to happen. In this case, the edge is dropped altogether.

A nice side-effect of 4 and 5 is to greatly reduce the influence of the Edgeryders team of moderators on the results. Moderators are among the most active users; while this is as it should be, they tend to “skew” the behaviour of the online community. However, 4 removes all the one-off interactions they tend to have with users that are not very active; and 5 removes all the edges connecting moderators to each other, because they – by virtue of being very active – interact with one another across many different briefs, and as a result the intersection of keywords across all their interactions tends to be zero.

6. Look for groups of specialists

We then identified groups of specialists by identifying those users interacting together solely around a small number of keywords (e.g. in example, n(keywords) = 2).
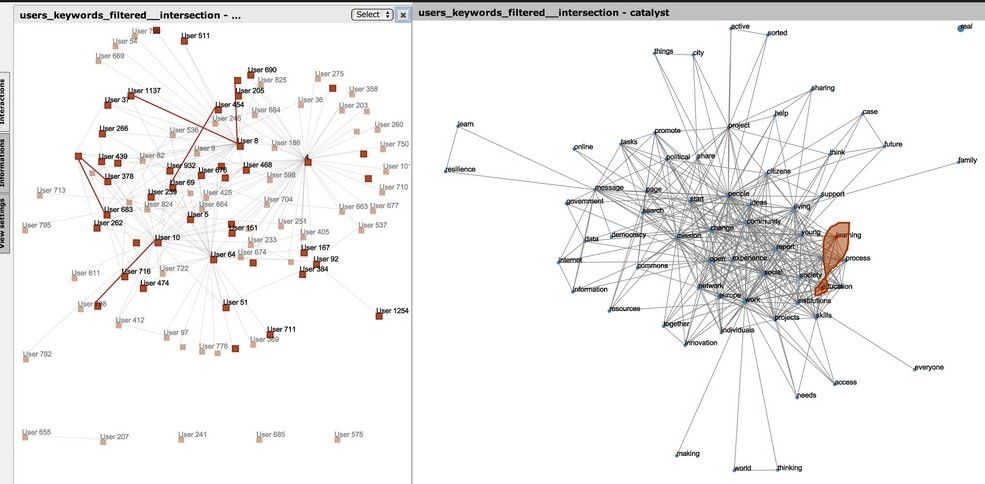
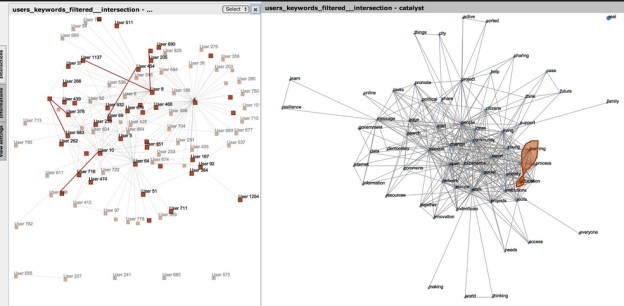
Figure 1. Specialized conversations on education and learning Figure 1. Detecting specialized conversations on education and learning.

Conclusions

The method does indeed seem to be able to identify groups of specialists. “Groups” is used here in the social sense of a collection of people that not only write content related to the keywords, but interact with one another in doing so – this is to capture the collective intelligence dimension of large scale conversations. Figure 1 shows some conversations between people (highlighted on the left) that only interact on the “education” and “learning” keywords (shown on the right). Highlighted individuals that are not connected to any highlighted edges are users who do write contributions that are related to those keywords, but are not part to specialized interactions on those keywords.

Once a group of specialists is identified, the next step is to look for the keywords that co-occur on the edges connecting them. An example of this is Figure 2, that shows the keywords co-occurring on the edges of the conversations involving our specialist group on education and learning. The size of the edge on the right part of the figure indicated that keyword’s contribution to entanglement, i.e. to making that group of keywords a cohesive one. Unsurprisingly, “education” and “learning” are among the most important ones. More interestingly, there is another keyword that seems to be deeply entangled with these two: it is “open”. We can interpret this as follows: specialized interaction on education and learning is deeply entangled with the notion of “open”. The education specialists in this community think that openness is important when talking about education.
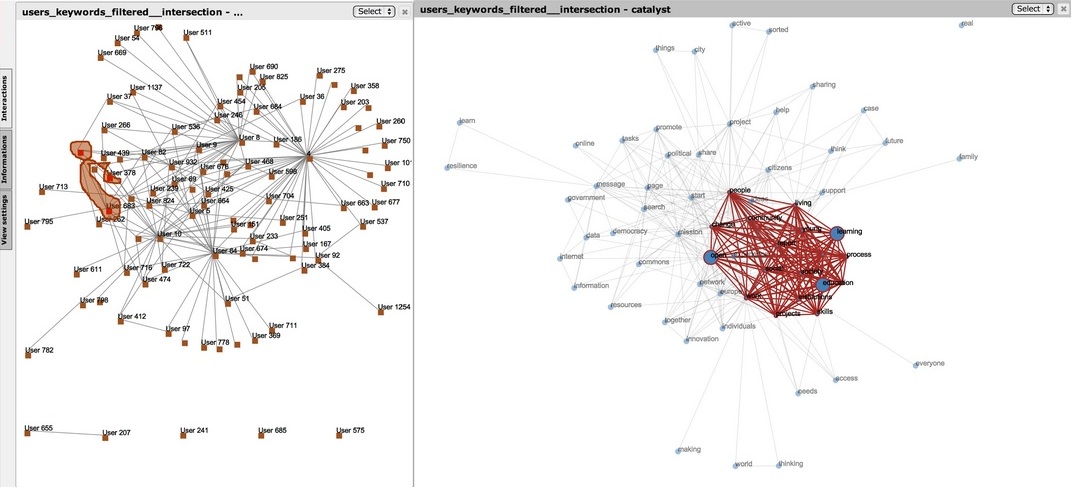
MoN2_Fig_2 Figure 3. Discovering more keywords entangled with the original two in the specialized conversation.

This method is clearly scalable. It can be used to identify “surprising” patterns of entanglement, which can then be further investigated by qualitative research.

Scope for improvement

The main problem with our method was that is is quite sensitive to the coding by keyword. Assigning the keywords was done by way of a quick hack based on occurrency count. This method should work much better with proper ethnographic coding. Note that folksonomies (unstructured tagging) typically won’t work, as it will introduce a lot of noise in the system (for example, with no stemming you get a lot of false (“degenerate”) specialist.)
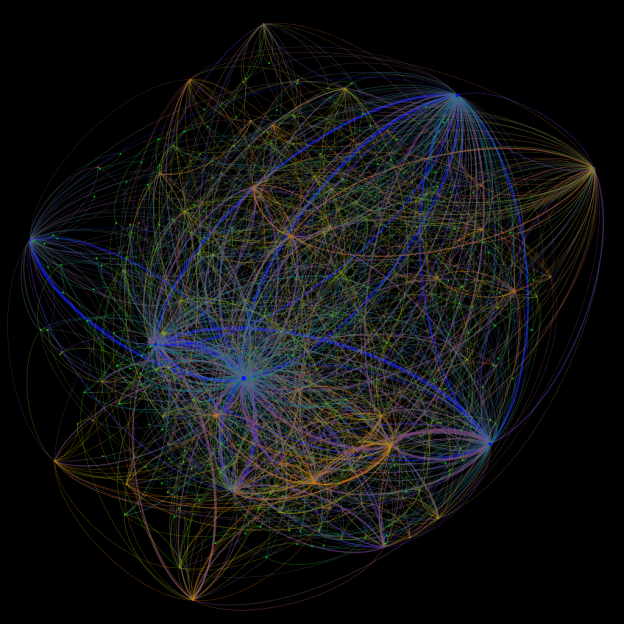
 

The Edgeryders conversation network in December 2012

Farming online conversations: assessing moderators impact with panel data econometrics (long)

Online communities have been my Swiss army knife for the best part of a decade. I tend to throw an online community at every problem I face – and that’s not limited to work: even my wedding party was organized that way.

We all know online communities have interesting properties, but how much can we control them? Can we “farm” them, growing one around each problem we are interested in? How expensive is this likely to be? These questions are relevant for my work, because we can’t use them as tools, as I tend to do, without some degree of control on them. I simply need to know if my intuition of online communities as general purpose collective intelligence tools is grounded, or if I am just delusional. As part of obsessing on this problem, two years ago I started a semi-structured research project, which is supposed to become a Ph.D. thesis. Some of the results are now in: the executive summary is that there seems to be evidence for our ability to artificially grow an online conversation about a specific problem.

Data source: the Council of Europe’s Edgeryders

I am using data from a project called Edgeryders. It was meant as a “distributed think tank”, an attempt to grow and harvest a large-scale online conversation around the task of building a proposal for reform European youth policy. The project was led by the Council of Europe and co-funded by the European Commission; it took place between late 2011 and the end of 2012. I was its director, as I worked at the Council of Europe at the time.

Edgeryders was based on an online interactive platform; its database if the source of all data described in this post. It worked like this: my team would ask it research questions grouped by topics (topics were broad issues like employment and income generations, education and learning etc.). Anyone was free to join and provide answers in the form of blog posts. All such blog posts were commentable for validation. By the end of the exercise, it had about 1200 registered users. Most were “lurkers” who never wrote anything on the platform. Those that did contribute were 260; collectively they wrote 500 posts and over 4000 comments. This material was analyzed by ethnographers, who used it to construct a publication on youth issues as seen from the youth themselves. The researchers obviously found Edgeryders material relevant for the task at hand. This, however, does not per se prove that we could really “farm” an online conversation around the issue of youth policy: maybe we simply intercepted a need to discuss the issue, and our efforts to grow and steer the conversation were in vain, or even counterproductive.

A small team of moderators devoted part of their time to encouraging users to share and discuss their point of view using positive reinforcement. This was a policy in the strict sense of the word: they were paid and instructed to engage users, especially first-time ones (“Hey, X, this is really interesting!”) ; ask them questions conducive to extracting issue-relevant information from the conversation; and connect them with other users with similar interests or approaches. Sometimes this would happen spontaneously, as the members of the Edgeryders community engaged one another; but when this did not happen by itself within hours of somebody writing a new post, the team of moderators was tasked with “breaking the ice.”

Modelling strategy

To assess the impact of the policy on the conversation, we proceed as follows. First, we model the Edgeryders conversation as a social network, whose nodes are active users and whose edges are comments. The network is directed: user i is connected to user j if i has commented some content (one or more posts or comments) written by j (comments are threaded in Edgeryders, so users can comment another comment). This was done by

  • using Datasource on the (Drupal) Edgeryders platform to extract relevant information from the database in JSON form;
  • writing a Python script to read the data and build the Edgeryders network, in conjunction with Tulip for graph analysis.

With dynamic network analysis still in its infancy, the main challenge to address this question was how to capture the time dimension of the data. I adopted the approach of “slicing” the course of the project into 57 one-week time periods, ranging from late October 2011 to December 2012. For each period I extracted the corresponding subgraph, using the following conventions:

  • “edges don’t die”. Let user i comment user j‘s content for the first time in period t. The edge from i to j appears in all graphs described from period t onwards. The interpretation of this convention is that, by interacting, i and j transform their relationships (among other changes, i is giving j a more or less explicit permission to interact with him or her) and this transformation is permanent in the context of the project (about one year).
  • nodes appear from the period in which they first create their Edgeryders account, even if they will only write their first contribution in subsequent periods. Nodes corresponding to not-yet active users will of course show up in the network as singletons, whereas nodes corresponding to users that will never become active are simply dropped from the network.

The final subgraph has 260 nodes and 4041 edges, many of them parallel to each other(same source and destination, different dates).

Once I had the slices, I needed a model of individual user behaviour that I could run against the data. The natural thing to do, with network data, would be to stay with a network approach, and estimate

 \forall i,j \in N P(e_i,j,t)|S_t

Where N is the number of nodes P(e_i,j,t) is the probability of user i forming an edge e_i,j at time t and S_t denotes the state of the system in terms of non-network variables at t. Unfortunately, this is not computationally viable. So, I collapsed network information into a vector of variables attached to each user, and allow it to vary over time. This transforms the problem into one of estimating

 A_i,t = f(A_{j \ne i, t}, EgoNetwork_{i,t} ,GlobalNetwork_{i,t} )

where:

  • A_i,t is the activity of user i at time t
  • A_{j \ne i, t} is the activity of other users at t
  • EgoNetwork_{i,t} is a vector of ego network variables (for example in-degree and clustering coefficient)
  • GlobalNetwork_{i,t} is a vector of global network variables (like density and modularity).

Once ego- and global network metrics have been computed for each time slice, this problem is tractable by panel data statistical techniques. Incidentally, notice that the relatively small size of each time slice – only one week – was chosen to capture the signal of the many lagged variables I had to use to avoid endogeneity issues. This, however, has the flip side of making most users inactive at most periods (13710 observations out of 14820 take value zero). This makes the dependent variable almost, but not quite, binary (taking value “nothing” in most cases and “something” in the rest). Therefore, the estimate was computed using a negative binomial model with fixed effects. This model estimates mostly the effect of regressors on activation (the probability of users to become active), but – unlike fully binary models like logits – it also uses the extra information encoded in users writing more than a post or comment in a given period.

An even more fundamental flip side is that this “flattening” of the network into a vector loses key information about the identity of who is connected with whom. In this first iteration, I kept track of whether inbound and outbound comments for each user come from moderators or non-moderators. Other refinements can be added.

Results

Preliminary data exploration shows evidence of structural change in early April 2012 (period 21). This corresponds to the date when a major Edgeryders conference, to be held in June the same year, was announced. People involved in the project confirm that this announcement was a game-changer in the project, as it made the Edgeryders proposition to its community much clearer and more credible – we referred to it as “addressing the what’s-in-it-for-you question”. We promised to cover travel expenses for about 50 contributors to the platform to get together in Strasbourg and flesh out the policy document that the Council of Europe would then advocate with respect to the European Commission and its own member states. We could spot structural differences across three subsets of the data: the first one describing activity in the interval before period 21; the second one describing activity of “old” users (who became active before period 21) after period 21; and the third one describing activity of users who became active in periods 21 and later.

The results of our negative binomial estimation for the whole dataset and for each of the three subsets are visible below.

To a first approximation, these results hold two lessons.

  1. Policy works. In all subsets as well as in the whole dataset receiving comments by moderators as well as by non-moderator community members has a positive and strongly significant impact (p-value < 0.01). This result is unambiguous.
  2. The network’s shape influences activity. All models show strongly significant influence of some variables capturing the shape of users’ ego networks as well as the global network. This is nontrivial, because some of these variables, like modularity, cannot be perceived directly, even by the most attentive users, without access to the database and network analysis software. However, these results are (still) ambiguous, and not consistent across subsets of data.

Implications

Result 1 has clear implications for online community managers running collective intelligence exercises. It says that user activity propagates across the conversation network, with each user receiving an impulse from in-neighbours and retransmitting it with its own input added (with some probability) to its out-neighbours. This is consistent with this paper by Nathan Hodas and Kristina Lerman, who find that contagion models explain well the spreading of information across online social networks after accounting for meme visibility as constructed by the designers of the online social networks themselves. The overall picture is reminescent of neural networks, a topic that I know little; it might be worth exploring this similarity further, as neural networks are in a sense a natural modelling choice for collectively intelligent organizational arrangements.

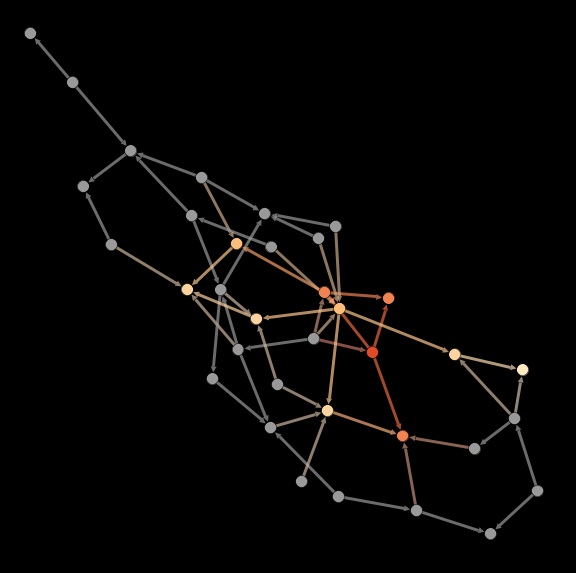
Contagion in a random directed network. Starting from the bright red node in the center (the moderator), the signal travels across the network.

Contagion in a random directed network. Starting from the bright red node in the center (the moderator), the signal travels across the network.

In a policy perspective, the result is saying that you can indeed “farm” an online conversation  by deploying one or more moderators/animators to interact with users. It works like this: a moderator engages directly some users; this increases the probability that they will become active; if they become active, this increases the probability that these first users out-neighbours will also become active and so on. This confirms anecdotal evidence: for example, as Shirky relates (source), photo sharing web 2.0 company Flickr deployed its own employees as the first users of the website, so that, when unpaid users came online, they found a lively conversation going on. Caterina Fake, Flickr’s CEO, reportedly remarked “You have to great the first ten thousand users personally”.

For online community managers, such a policy has two attractive properties.

  1. Firstly, there is a sort of multiplier effect: moderators activate users, whose activity in turn activates other users – remember, the coefficients on both comments received by moderators and comments received by non-moderators is strongly significant.
  2. Secondly, it does not matter which users in particular are targeted by moderators initially, because the activation signal propagates across the network according to some contagion model (video). To a first approximation, propagation will be limited only by the size of the strongly connected component that the signal starts in (though of course the size and topology of the giant component is itself endogenous to user activity; by becoming active, users can choose to activate new edges). Most real-life social networks tend to evolve towards a topology that features a giant component gathering a large share of all participants. In December 2012, the Edgeryders conversation network featured a giant strongly connected component that gathered more than 50% of active users. 100% of active users were part of a weakly connected giant component.

So, the model’s implications for the community managers wishing to “farm” an online conversation around a specific topic can be translated into two simple rules:

  1. Deploy moderators to engage users. This policy increases activity.
  2. Try to connect users with other users. This policy increases connectivity and, critically, the size of the network’s giant component. Moderators in Edgeryders were instructed to do just that, trying to match new users to existing ones on the basis of their first contributions (“Hey, Anna, this is really interesting! Something similar, but with a very different slant, has been proposed by Bob at this link…”).

The more activity and connectivity there are in the network, the less the conversation needs moderator effort to keep going. This is not so intuitive, and indeed online community managers tend to think it is the number of users, not the number of connections among them, that drive a conversation towards being self-sustaining. Again, if true this is excellent news for people who, like me, deploy online networks to attack problems by a collective intelligence approach, because it implies that you can get nearly self-sustaining (hence cheap to maintain) conversations even with relatively small networks, in the hundreds of low thousands of active users. This is because the potential connections in a graph grow quadratically with respect to the number of its nodes, so for a given level of performance, moderators can reduce costs both by attracting new users and by connecting existing users to each other.

What to monitor?

In the context of the CATALYST project, I am involved in an effort to build easy-to-install social network analysis software for common CMSs. Based on the above discussion, what should this software monitor? I would suggest:

  1. a visualization mode that makes it easy to tell the activity of moderators from that of non-moderators.
  2. the number of strongly connected components,  making sure that moderators engage each one.
  3. the size of the largest strongly connected component, both absolute and relative to the conversation network, as an indicator of conversation self-sustainability.

What do you think?

I wish to acknowledge the role of the Council of Europe in launching the project and firing me to lead it; of the University of Alicante, the INSITE project and IUAV for supporting my research; and to Giovanni Ponti, Luigi Di Prinzio, Guy Melançon, Benjamin Renoust and Raffaele Miniaci for their invaluable help and generosity. Financial support from the Spanish Ministerio de Economía y Competitividad (ECO2012-34928) is gratefully acknowledged.

Learning from the Twitterstorm: an architecture for effortless collaboration

“We have no idea how a press conference on Twitter is going to pan out, of course. But it sounds like fun, so we’ll try it anyway.” In their typical just-trying-stuff-out style, about a month ago, a bunch of people over at Edgeryders invented, more or less accidentally, a format we now call Twitterstorm (how-to). The idea is to coordinate loosely in pushing out some kind of content or call to action using Twitter. The first Twitterstorm was aimed at raising awareness of the unMonastery and its call for residencies; it worked so well the community scheduled immediately another one, this time to promote the upcoming Living On The Edge conference, affectionately known as LOTE3.

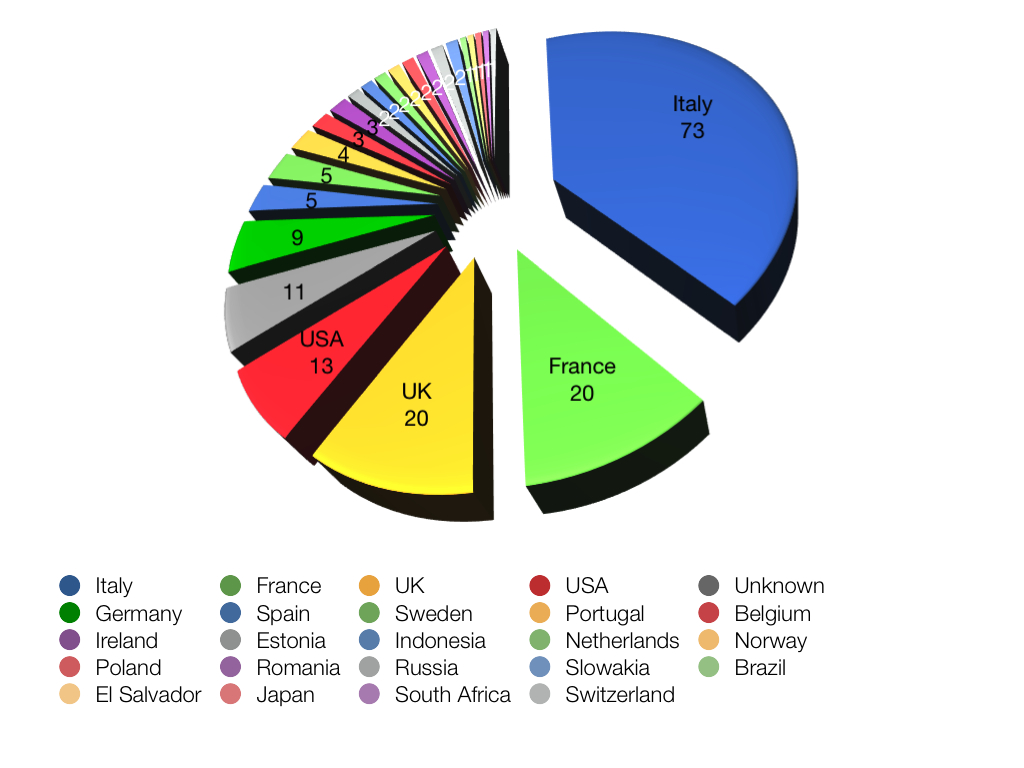
LOTE3 is to take place in Matera, Italy: the same city is to host the unMonastery prototype. So, we thought we would try to get people in Matera involved in the Twitterstorm, as an excuse to build some common ground with the “neighbors”. This second Twitterstorm took place on October 14th at  11.00 CET: like the first, it was a success, involving 187 Twitter users and 800 tweets (in English, Italian, Portuguese, Russian, Swedish, French, German, Romanian) in the space of two hours. Apparently we reached 120,000 people worldwide, with almost 800,000 timeline deliveries (source). We hit number 1 trending topic in Italy (in the first Twitterstorm we hit number 1 in Italy and Belgium). Traffic to the conference website spiked. All of this was achieved by a truly global group of people: I have counted 23 nationalities. We promoted an event in Italy, but Italian accounts were less than 40% of those involved.

Twitterstorm_by_country

All this came at surprisingly little effort. People came out of the woodwork and participated, each with their own style, language and social media presence: despite all the diversity, the T-storm seemed to have some sort of coherence that made it simple to understand: people would notice the hashtag popping up in their timelines and go “Whoa, something’s going on here”. How is it possible that people with minimal coordination over the Internet; with such diverse backgrounds and communication styles; that don’t speak the same language and don’t even know each other, can cohere in an instant smart swarm and deliver a result? And, just as important: did we build community? 

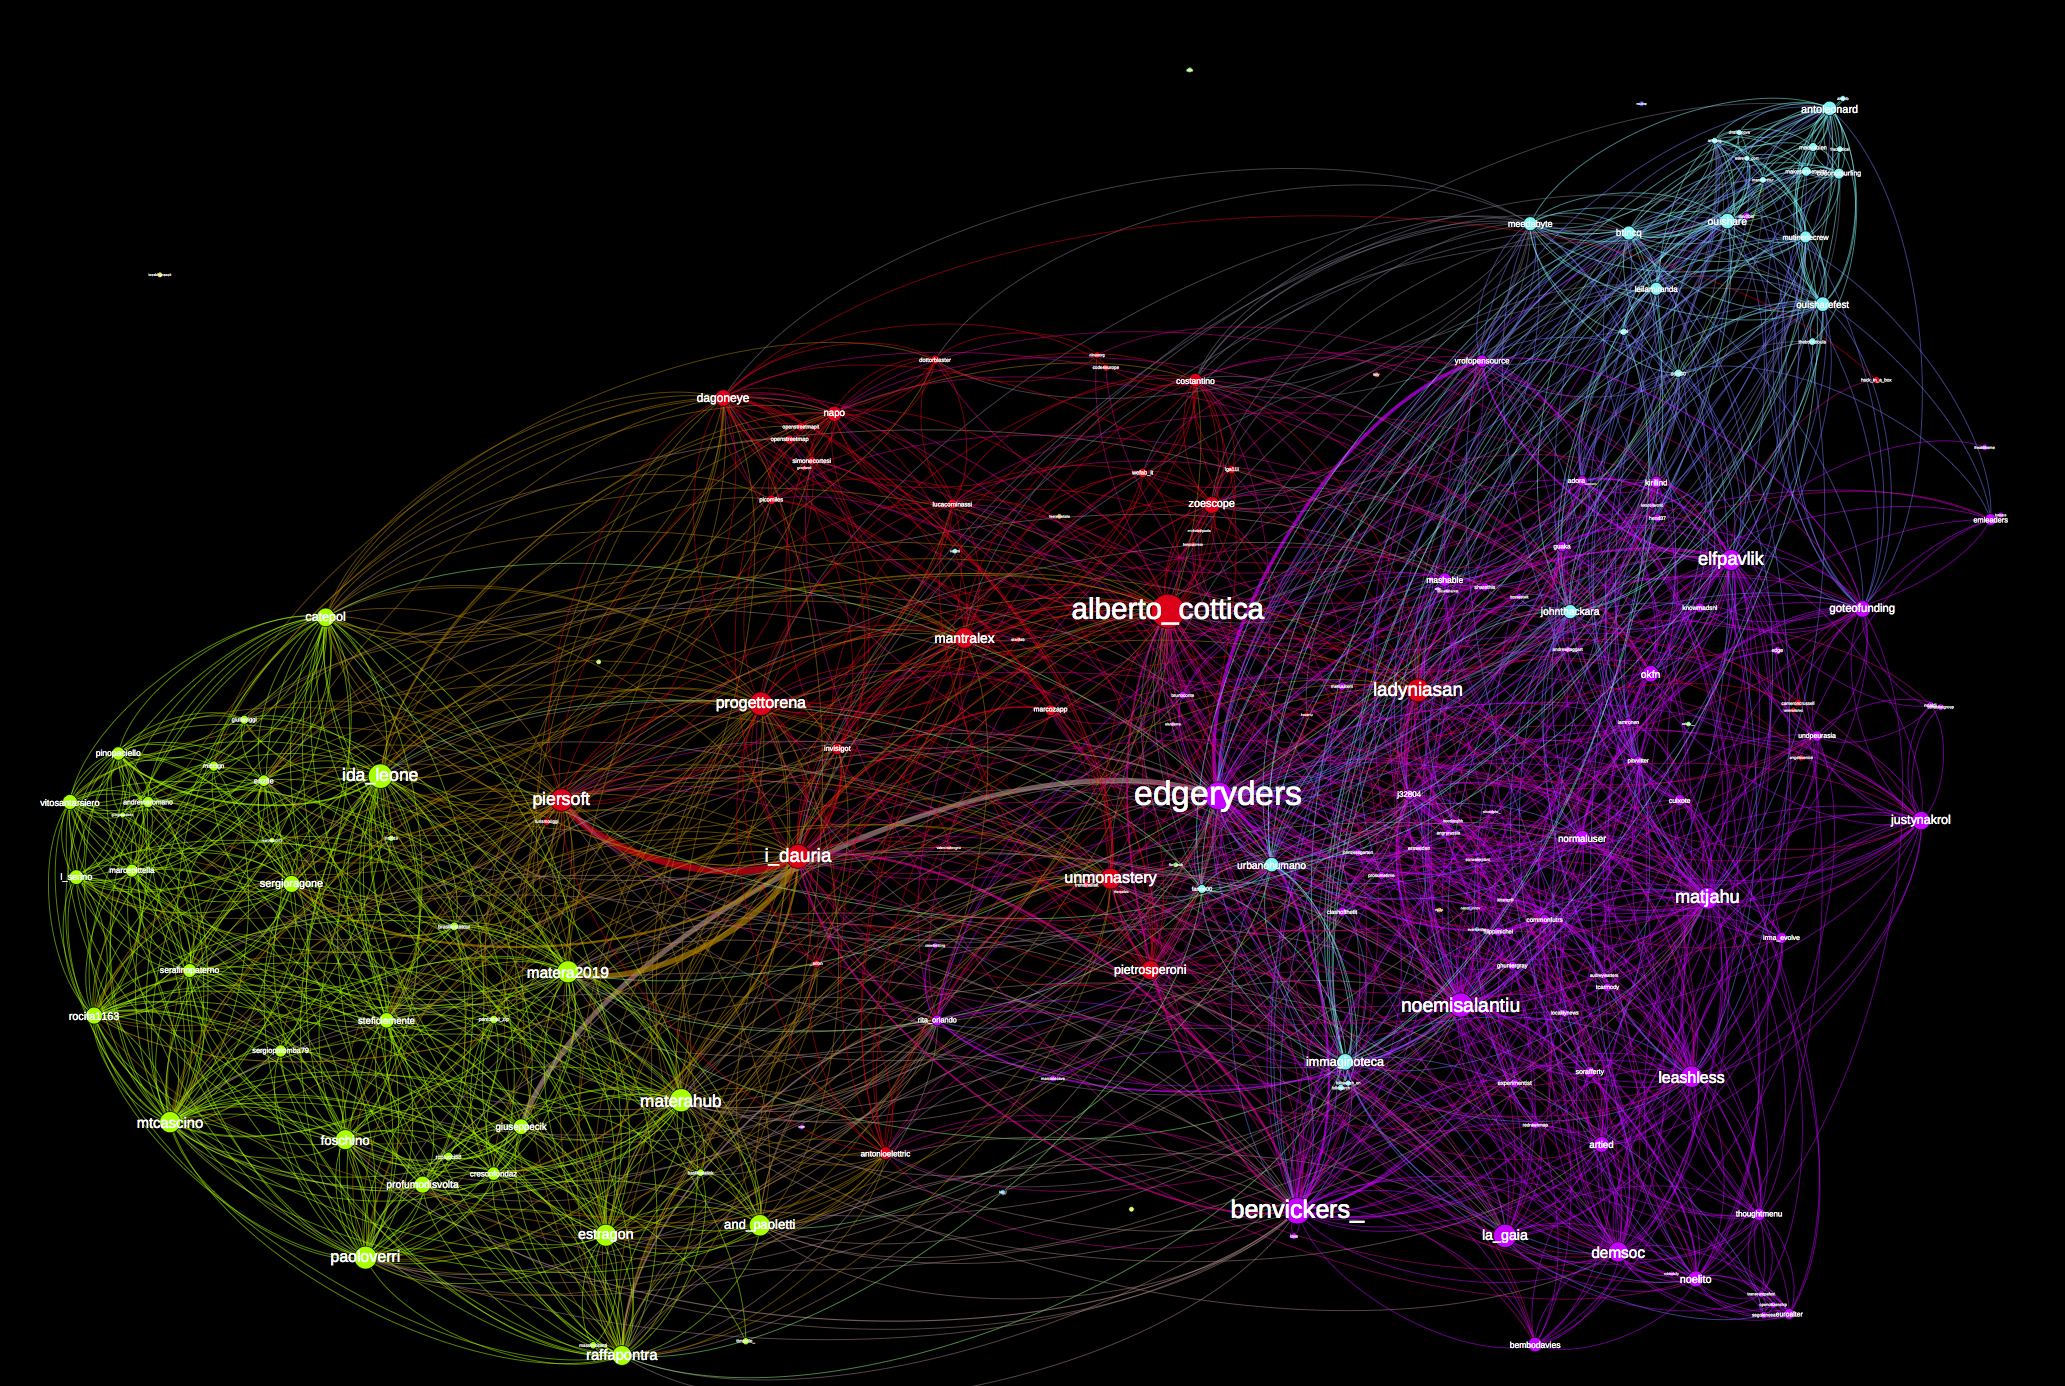
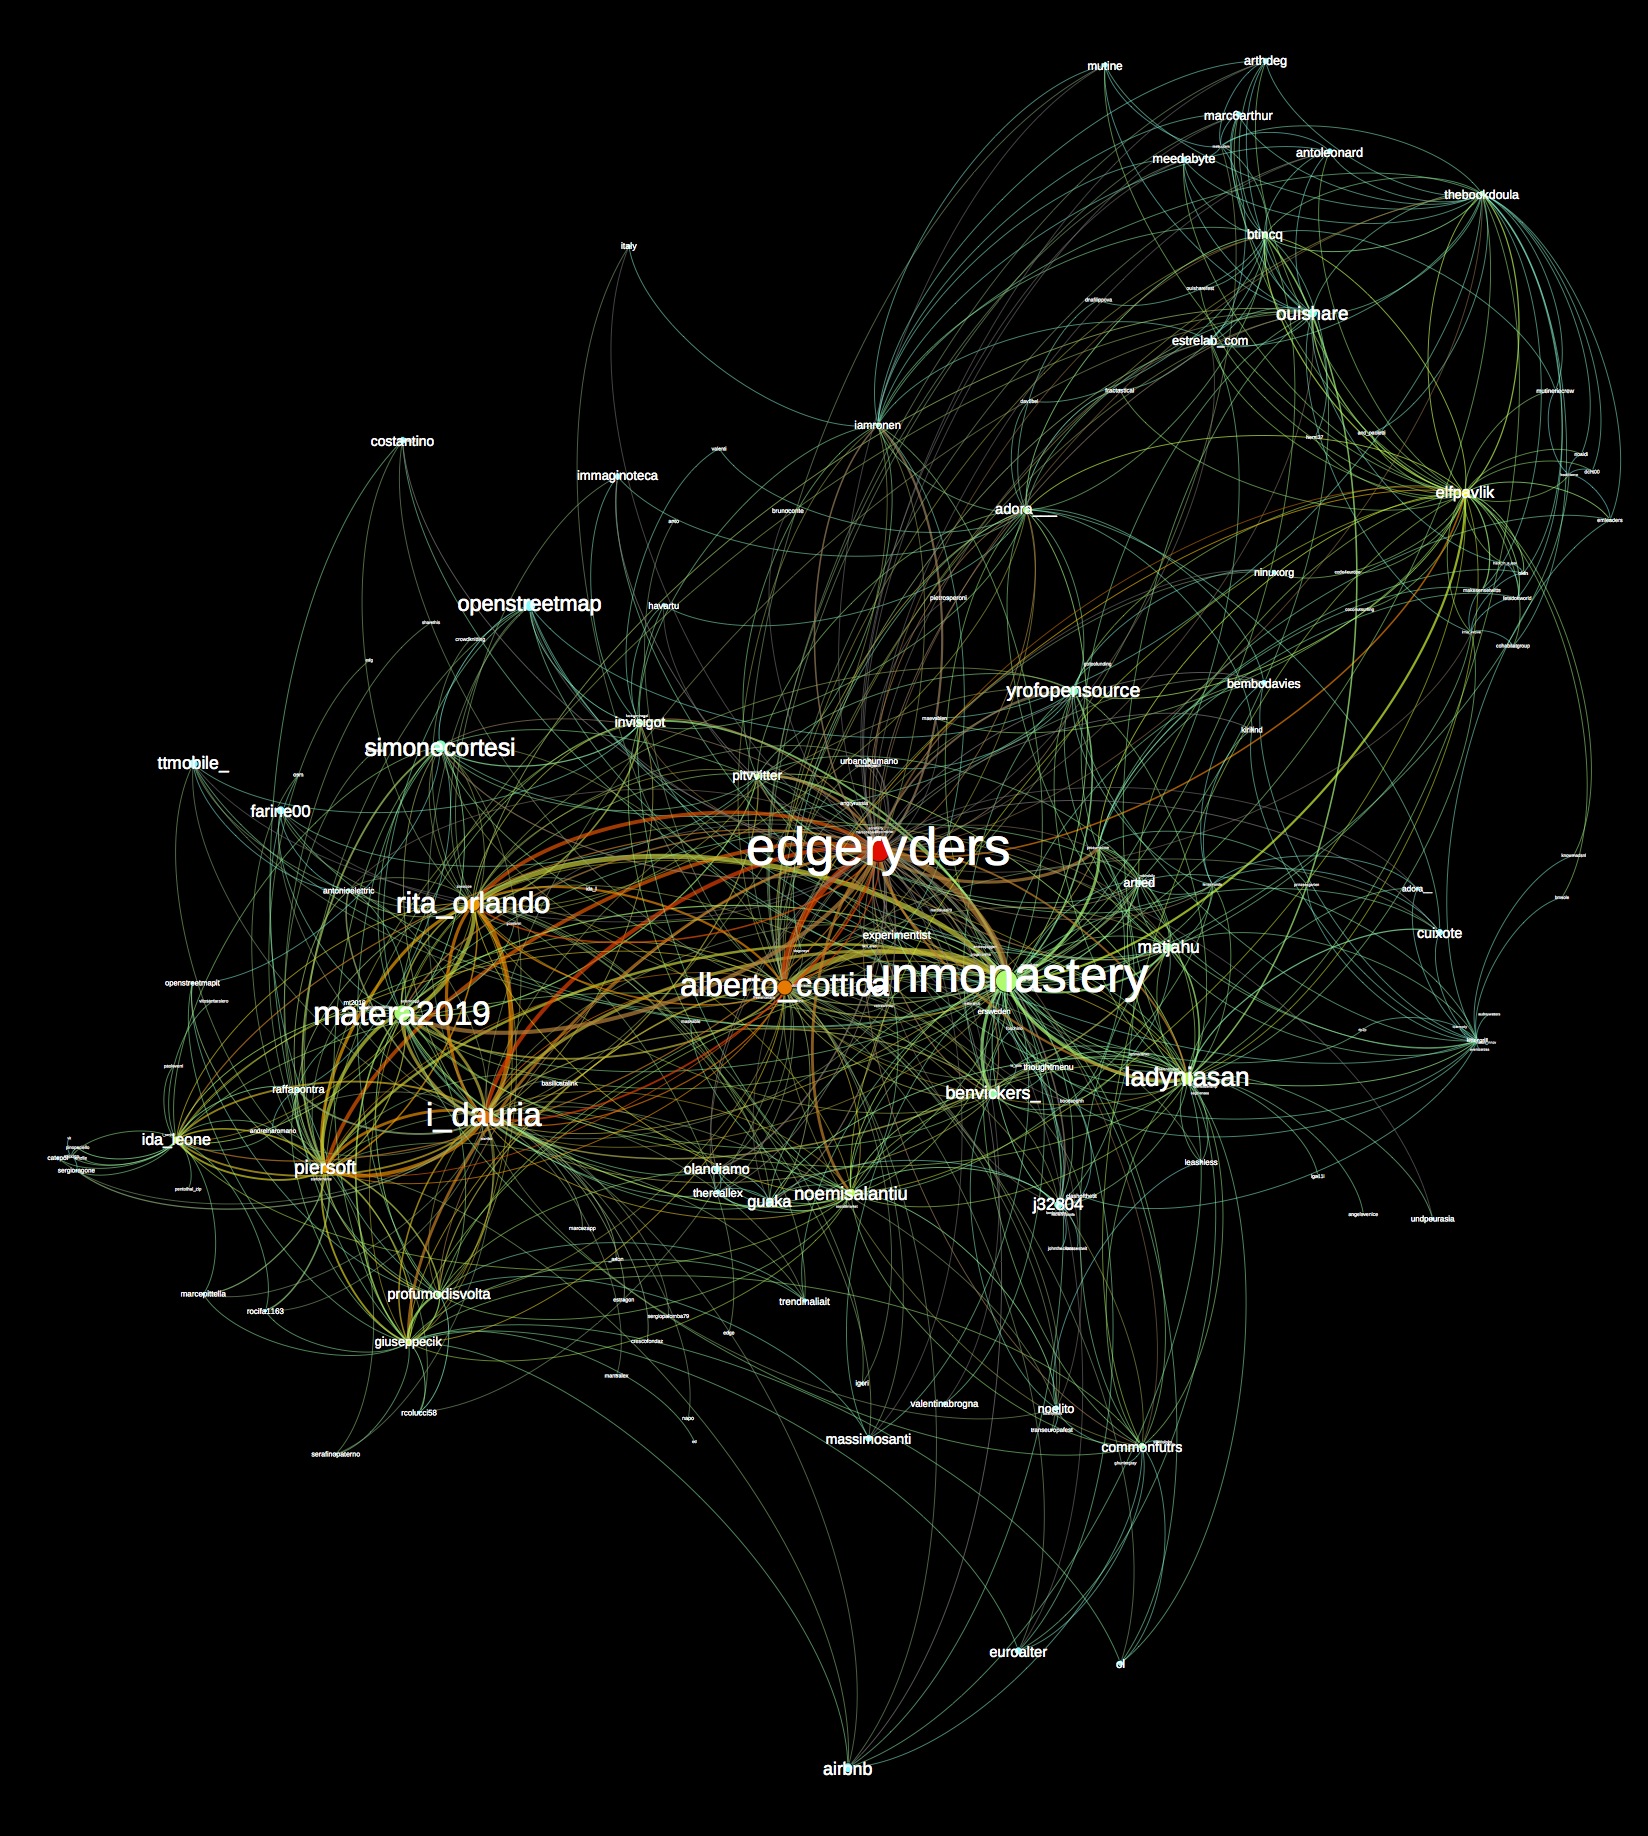
As I am fond of saying when complex questions are asked concerning online social interaction, turns out I can measure that. Let’s start with the first question, how can such coherence arise from so little coordination. The picture above (hi-res image) visualizes the Twitterstorm as a network, where nodes are Twitter accounts and edges represent relationships between them. Relationships can be of three kinds, and all are represented by edges. An edge from Alice to Bob is added to the network if:

  • Alice follows Bob;
  • Alice retweets one of Bob’s tweet that includes the hashtag #LOTE3;
  • Alice mentions Bob with a tweet that includes the hashtag #LOTE3.
  • Tweets that are neither replies nor retweets containing the hashtag are represented in the network as loops (edges going from Alice back to Alice herself).
  • multiple relations map on weighted edges and are represented by thicker edge lines.

In the visualization, the size of the fonts represents a node’s betweenness centrality; the size of the dot its eigenvector centrality; the color-coding represents subcommunities in the modularity-maximizing partition computed with the Louvain algorithm (this network is highly modular, with Q = ~ 0.3). The picture tells a simple, strong story: the Twitterstorm group consists of three subcommunities. The green people on the left are almost all Italians, living in or near Matera, or with a strong relationship to the city. The blue people on the right are mostly active members of Ouishare, a community based in Paris. The red people in the middle are the Edgeryders/unMonastery community (note: the algorithm is not deterministic. In some runs the red subcommunity breaks down into two, much like in the network of follow relationships described below). Coordination across different subcommunities is achieved by information relaying and relationship brokerage at two levels:

  1. at the individual level, some “bridging” people connect subcommunities to each other. For example, alberto_cottica, noemisalantiu, i_dauria and rita_orlando all play a role in connecting the Materans to the edgeryders crowd. On the other side, ladyniasan and elfpavlik are the main connectors between the latter and the Ouishare group.
  2. at the subcommunity level, the ER-uM subcommunity is clearly intermediating between the Materans and Ouisharers.
  3. Each subcommunity is held together by some locally central, active individuals. You can see them clearly: piersoft, matera2019 and ida_leone for the Materans; edgeryders and unmonastery for the ER-uM crowd (these have many edges connecting them to the Materans): ouishare and antoleonard for the Ouishare group.

So, this is why doing the Twitterstorm seemed so effortless: this architecture allows each participant to focus on her immediate circle of friends, with no need to keep track of what the whole group is going. Bridging-brokering structures ensure group-level coherence.

To answer the second question, “did we build community?”, I need to look into the data with some more granularity. We can distinguish edges between the ones that convey short-term static social relationships from those that represent active relationships. Following someone on Twitter is a static relationship: Alice follows Bob if she thinks Bob is an interesting person that shares good content. Typically, she will follow hime over a long time. Mentioning or retweeting someone, on the other hand, is an action that happens at a precise point in time. Based on this reasoning, I can resolve the overall Twitterstorm network in a “static” network  of follower relationships – representing more or less endorsement and trust – and an “instant” network of mentions and retweets – representing more or less active collaboration in the Twitterstorm. The first of the two can be assumed to represent the pattern of trust that was built: it would be nice to confront it with the same network as it was before the Twitterstorm, but unfortunately our data do not allow us to do that. We can think of the second network as the act in which community was (or not) built.

The network of trust is not so different from the overall one, but now there are four subcommunities instead of three (Q = ~ 0.33):

Twitterstorm – Follow Relationships

As before, the Matera group is clearly visible and depicted in green; the Ouishare group is also recognizable in blue. The red subcommunity now consists almost exclusively of Italians – most of them not in Matera, who have strong international ties. The ER-uM group is now depicted in purple. In terms of the static network, then, the coordination between Materans on one end and Ouisharers on the other end was intermediated twice: first by a (red) group of internationally connected Italians, then by a (purple) pan-European community gathered around Edgeryders. This is also another legitimate interpretation of the overall T-storm network.

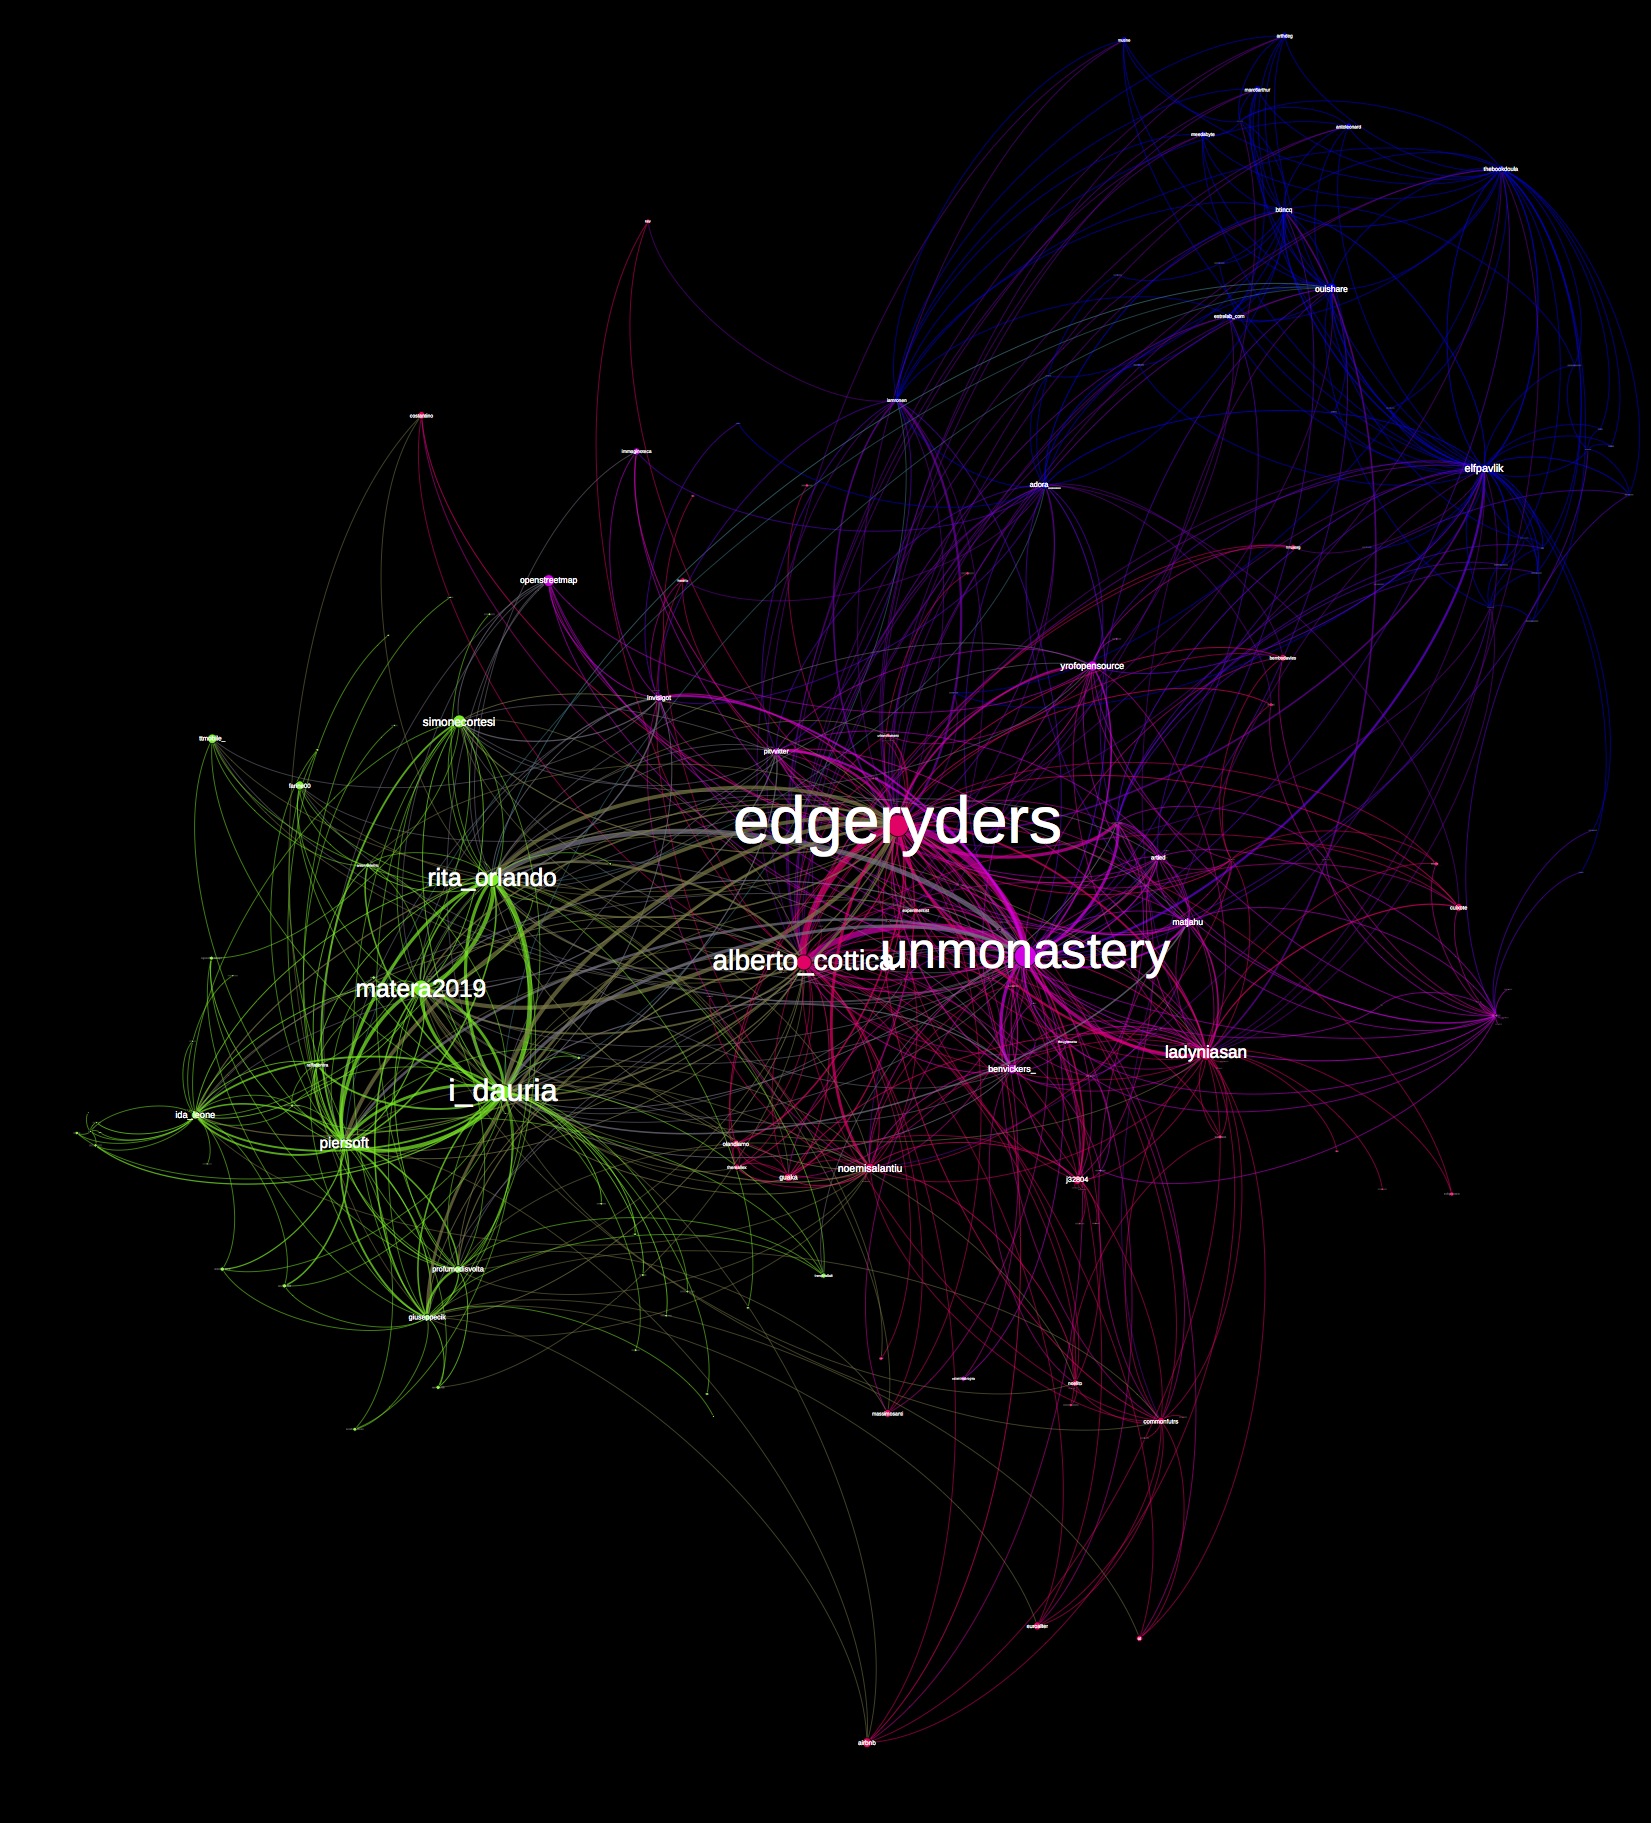
When we consider the “active” network of mentions and retweets that developed on Monday 14th, we find a rather different situation. Again, the components are four: but this time, the two central subcommunities seem more a mathematical effect of the high level of activity of the most active users, chiefly edgeryders, unmonastery and alberto_cottica, than clearly delimited subcommunities. Most of the modularity (which is even higher than in the two previous networks, Q = ~ 0.35) stems for the very clearly marked subcommunities to the left (Materans) and right (Ouisharers). No surprises here.

Twitterstorm – Mentions

The picture below visualizes a higher weighted outdegree in redder colors on a blue-red spectrum. Redder nodes have been more active in mentioning and engaging the nodes they are connected to. The redder areas in the network are not within the subcommunities, but across them: most of the orange and red edges connect the Matera subcommunity (i_dauria, matera2019, rita_orlando, piersoft) with the ER-uM one (edgeryders, alberto_cottica). On the right, elfpavlik is busy building bridges between Ouisharers and ER-uM. So yes, we did build community. You are looking at community building in action!

Twitterstorm mentions outdegree heat map

Provisionally, as we wait for better data, we conclude that the Twitterstorm not only was dirt cheap, fun and good publicity, but it also left behind semi-permanent social effects, pulling the three communities involved closer together. Doesn’t get much better than that!