The latest years have seen an unmistakable drive towards government agencies, local and regional authorities and public institutions in general to spawn online communities. For many reasons (desire to harness collective intelligence online; need for legitimacy through open participation; top-down policy drive for modernization) they come, and will probably keep coming. This, however, raises the issue of funding. How much do public-sector funded online communities really cost? How do their running costs evolve over time? Some commentators think that citizen engagement online is very cheap to maintain – after all, citizen engagement is the civic equivalent of user generated content, and user generated content is made by users, for free. There can be significant costs to get one going, associated to purchasing and deploying technology and investing in its startup, but then one can relax, sit back and enjoy the flight.
My experience, and that of numerous colleagues, is that this is largely a myth. It is probably true for very large communities, in which even a tiny share of active users can drive a lot of activity because even a a tiny minority is still a lot of people in absolute numbers. But the communities typically spawned by government authorities are generally small: less than a thousand for mobility in Milano, a few thousands for peer-to-peer collaboration on business plans for the creative industries in Italy, maybe a few tens of thousands somewhere else – forget it. I learned this the hard way, as administrative uncertainty almost crashed the previously buzzing community of Kublai.
But, if public policy-oriented online communities are not 100% self-sustaining, many do display some degree of sustainability – and therefore, all other things being equal, of cost advantages. This was certainly true of Kublai: almost three years of administrative uncertainty and false starts have undermined it, but not killed it. The community was still showing signs of vitality in July 2012, when the new team finally was hired. So, how can we measure the degree of sustainability?
An intuitive way to do it is to look at user generated content vs. content created by paid staff. It works like this: even if you have the best technology and the best design in the world, a social website is by definition useless if no one uses it. The result is that nobody wants to be the first to enter a newly launched online community. Catherina Fake, CEO of the photo sharing website Flickr, found a clever workaround: she asked her employees to use the site after they had built it. In this way, the first “real” users that wandered in found a website already populated with people who were passionate about photography – they were also paid employees of the company, but this might not have been obvious to the casual surfer. So the newcomers stayed in and enjoyed it, making the website even more attractive for other newcomers, kickstarting a virtuous cycle. With more than 50 million registerered users, now Flickr presumably does not need its employees to stand in as users any more.
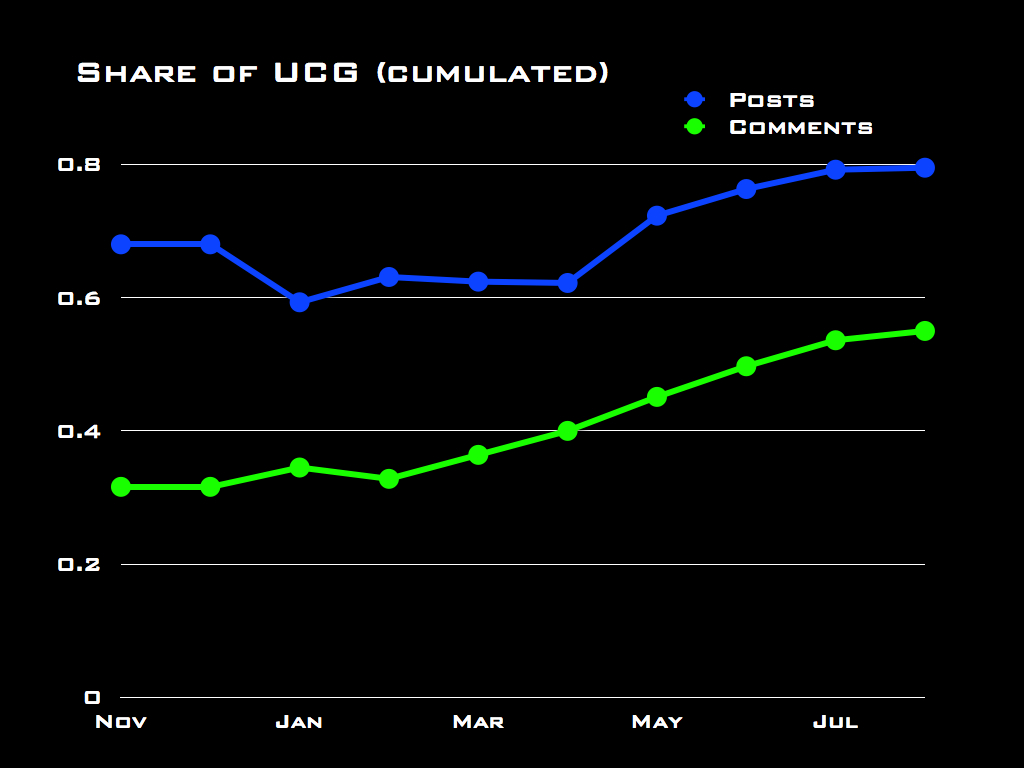
Let me share with you some data from Edgeryders. This project, just like many others, employs a small team of animators to prime the pump of the online conversation. Think of it as a blogging community with writing assignments: people participate by writing essays on the proposed topics, and by commenting one another’s submission. At the time I took the measurement (July 19th 2012) there were 478 posts with 3,395 comments in the Edgeryders database. The community had produced a vast majority of the posts – 80% exactly – and a much smaller majority of the comments – 55%. Over time, the community evolved much as one would expect: the role of the paid team in generating the platform’s content is much stronger at the beginning, and then it declines over time as the community gets up to speed. So, the share of community-generated content over the total is clearly increasing (see the chart above). Activity indicators in absolute terms have also increased quite fast until June, then dropped in July as a part of a (planned) break while the research team digests results. In this perspective, the Edgeryders community seems to display signs of being at least partly sustainable, and of its sustainability increasing. However, I would like to suggest a different point of view.
When talking about the sustainability of an online community, a relevant question is: what is it that is being sustained? In a community like Edgeryders (and, I would argue, in many others that are policy-oriented) it is conversation. The content being uploaded on the platform is not a gift from the heavens; rather it is both a result of an ongoing dialogue among participants and its driver. As long as the dialog keeps going, it keeps appearing in the form of new content. So, a better way to look at sustainability is by looking at the conversation as a network and asking what would happen to that conversation if the team were removed from it.
We can address this question precisely in a quantitative way with network analysis. My team and I have extracted network data from the Edgeryders database. The conversation network is specified as follows:
- users are modeled as nodes in the network
- comments are modeled as edges in the network
- an edge from Alice to Bob is created every time Alice comments a post or a comment by Bob
- edges are weighted: if Alice writes 3 comments to Bob’s content an edge of weight 3 is created connecting Alice to Bob
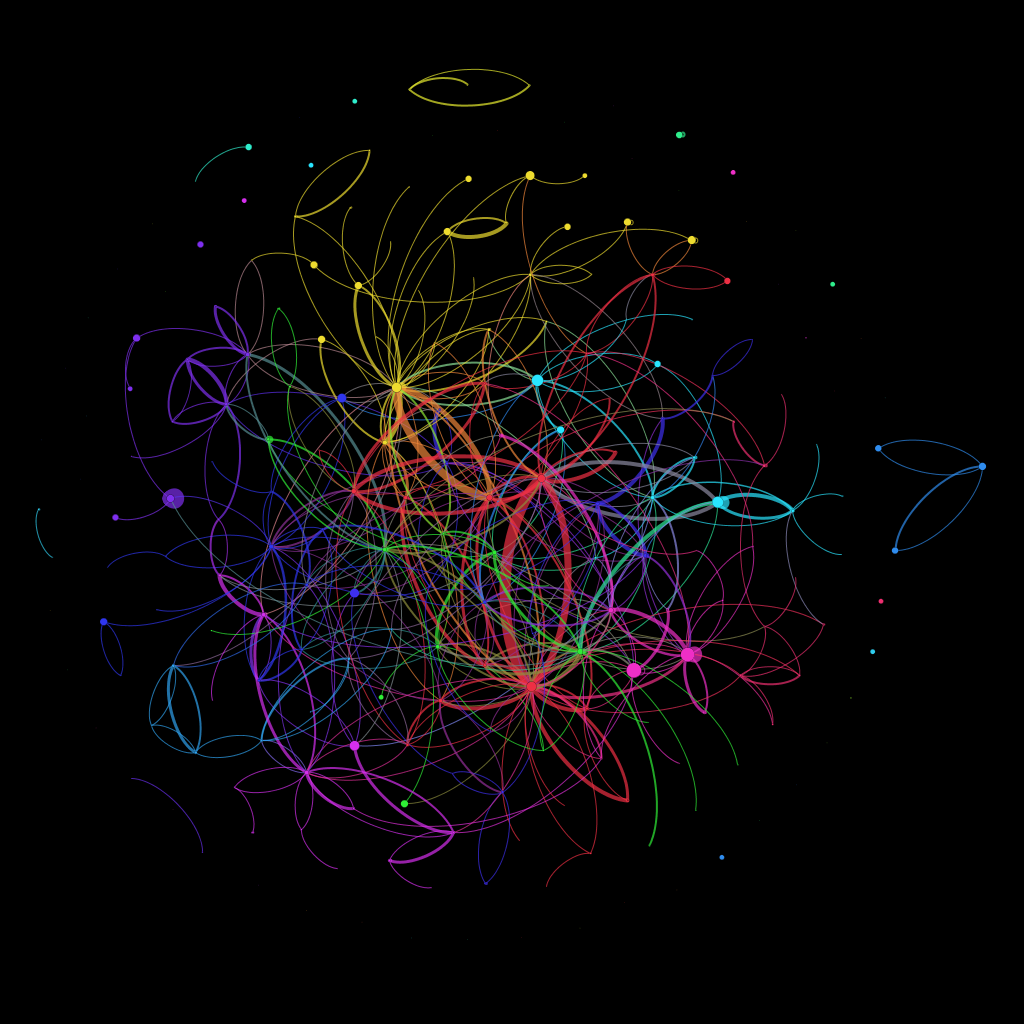
Thus specified, the Edgeryders network in mid-July 2012 consists of 3,395 comments, and looks like this:
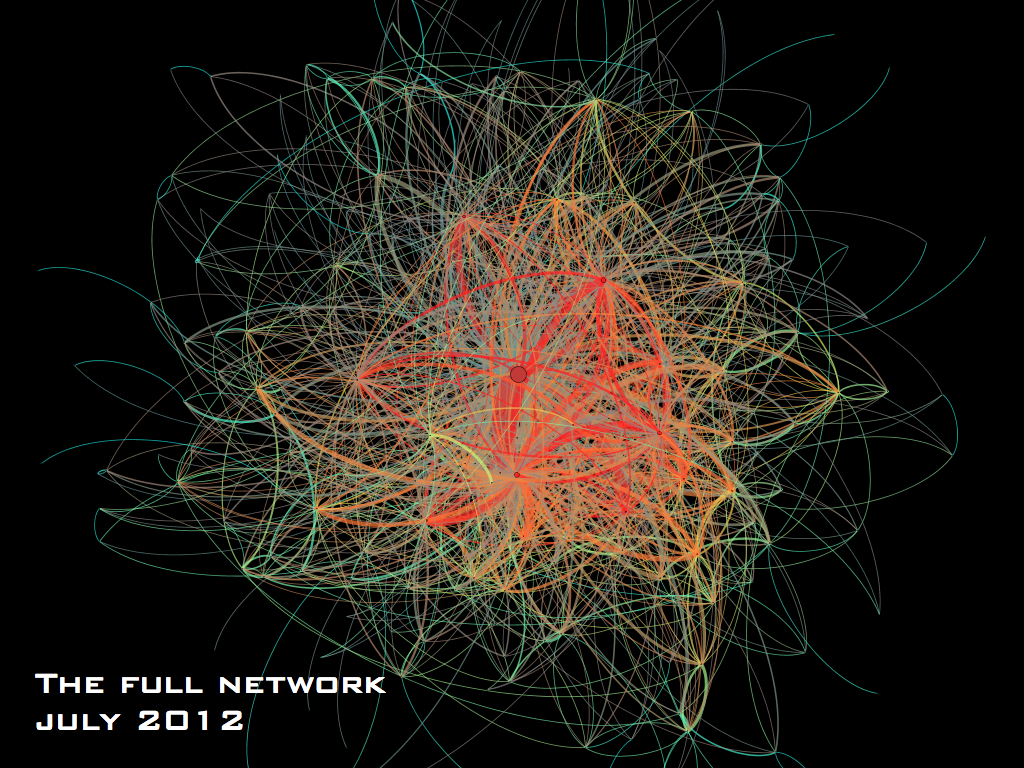
Colors represent connectiveness: the redder nodes are more connected (higher degree). What would happen to the conversation if we suddenly removed the contribution of the Edgeryders team? This:
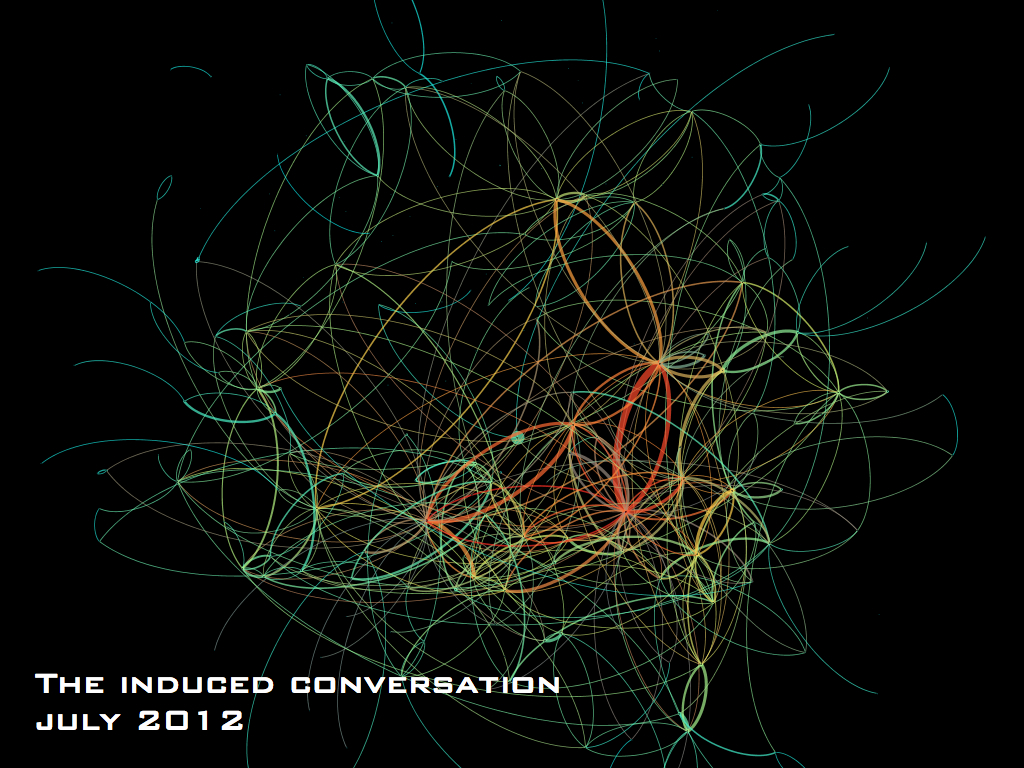

I call this representation of an online community its induced conversation. It selects only the interactions that do not involve the members of the team – and yet it is induced in the sense that these interactions would not have happened at all if the community managers had not created a context for them to take place in.
Even from simple visual inspection, it seems clear that the paid team plays a large role in the Edgeryders conversation. Once you drop the nine people that, at various stages, received a compensation to animate the community all indicators of network cohesion drop. An intuitive way to look at what is happening is:
- the average active participant in the full Edgeryders network interacts directly with 6.5 other people (this means she either comments or receives comments from 6.5 other members on average). The intensity of the average interaction is a little over 2 (this means that, on average, people on Edgeryders exchange two comments with each person they interact with). Dropping the team members, the average number of interactants per participant drops to 2.4, and the average intensity of interactions to just above 1.5. Though most active participants are involved in the induced conversation, for many of them the team members are an important part of what fuels the social interactions. Dropping them is likely to change significantly the experience of Edgeryders, from a lively conversation to a community where one has the feeling she does not know anyone anymore.
- more than three quarters of active participants do interact with other community members. However, only a little more than one third of the interactions happens between non-team community members, and do not involve the team at all. Notice how these shares are lower than the shares of community generated vs. team generated content.
- 49 out of 219 non-team active members are “active singletons”: they do contribute to user-generated content, but they only interact with the Edgeryders team. Removing the latter means disconnecting these members from the conversation. There is probably a life-cycle effect at work here: new members are first engaged by the team, which then tries to introduce the newcomers to others with similar interest. This is definitely what we try to do in Edgeryders, and I have every intention to use longitudinal data to explore the life-cycle hypothesis at some later stage.
- the average distance from two members is 2.296 in the full network, but increases to 3.560 when we drop the team. The team plays an important role in facilitating the propagation of information across the network, by shaving off more than one degree of separation on average.
From an induced conversation perspective, it seems unlikely that the Edgeryders community could be self-sustaining. The willingness of its members to contribute content lies at least in part on the role played by its team in sustaining the conversation, making the experience of participating in Edgeryders much more rewarding even in the presence of a small number of active users.
That said, it seems that the community has been moving towards a higher degree of sustainability. If we look at the share of the Egderyders active participants that take part in the induced conversation, as well as the share of all interactions that constitute the induced conversation itself, we find clear upward trends:
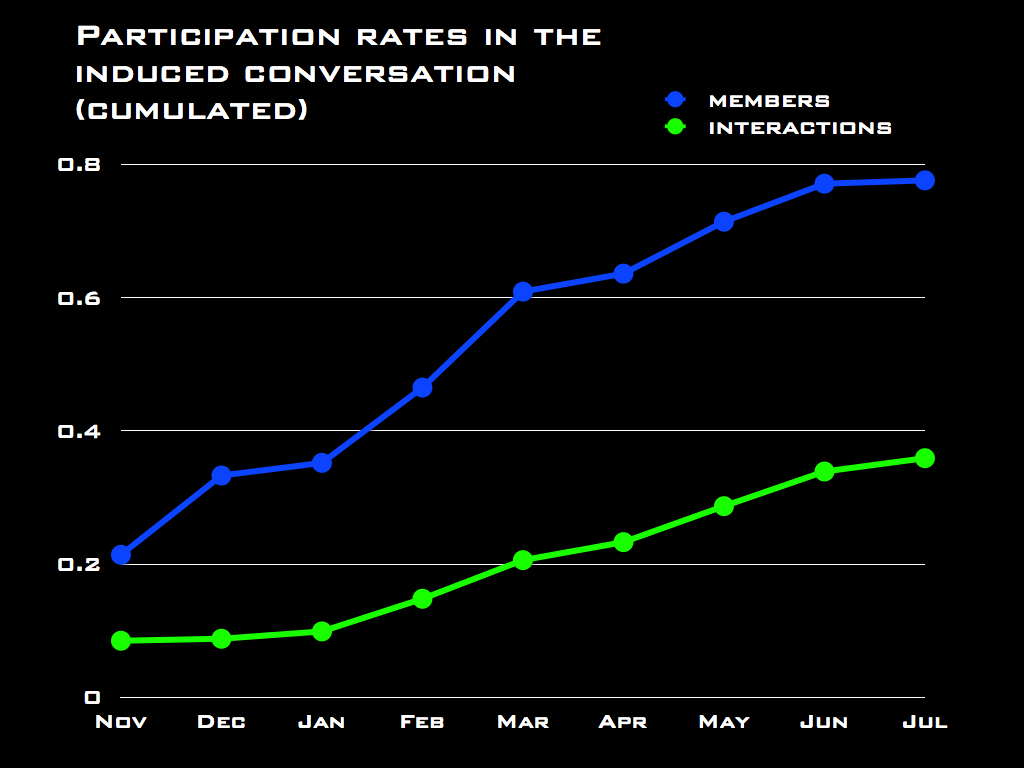

Based on the above, I would argue that these data can be very helpful in making management decisions that concern sustainability. If you find yourself in a situation like that of Edgeryders in July and you run out of funding, for example, my recommendation would be to “quit while you are ahead”: shut the project down in a very public way while participants have a good perception of it rather than letting it die a slow death by the removal of its team. On the other hand, if you are trying to achieve a self-sustainable community, you might want to target indicators like average degree, average intensity of the interactions (weighted degree), average distance and rates of participation to the induced conversation, and try out management practices until you have established which ones affect your target indicators.
It’s trial and error, I know, but still a notch up the total steering by guts prevailing in this line of work. And it will get better, if we keep at it. Which is why I am involved in building Dragon Trainer.
See also: how online conversations scale. Forthcoming: another post on conversation diversity, all based on the same data as this.


