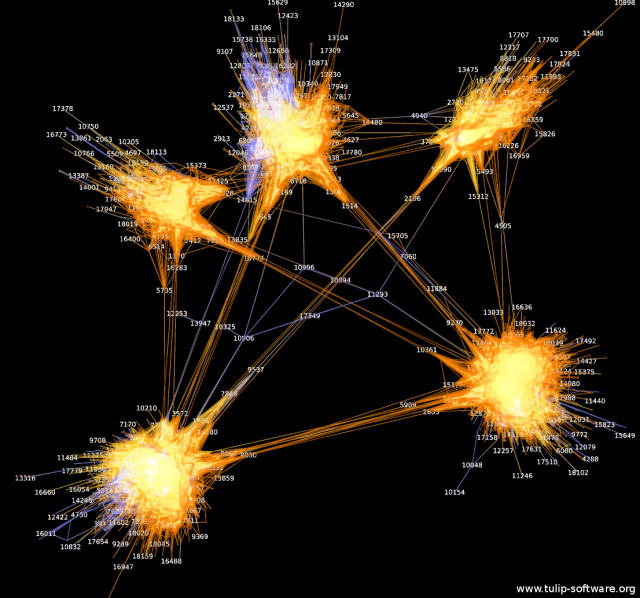
Regular readers may remember that I am trying to build software for near- real time network analysis of online conversations – think Google Analytics, but focused on relationships between users of a website rather than counting pageviews. I hope to use it to research the mathematical signatures of different social phenomena that happen online. My overarching goal is contributing towards maintaining conversations healthy and useful at a large scale, and so finally make participatory democracy work at the level of the large city, the nation state, even the planet.
I have now a new strategy, based on a network analysis package called Tulip.
Why Tulip? I have been using Gephi so far, and there is much to be said for Gephi – it has a larger community than Tulip’s and more functionalities. The answer is: Python. The core of Tulip, stripped of the GUI, is a Python library. This means that I can have a very short chain to monitor changes in the network representing a conversation. My favorite configuration would look something like this:
- The analysis concerns a community website running on Drupal + MySQL.
- A module called views_datasource gives the core module Views the ability to query the database and export the results of the query as a JSON file.
- A Python script, armed with the JSON Python library (which is the part I am writing now) parses the JSON and maps elements in the database to relationships, i.e. directed edges from some entity to some other. Which elements you want to map onto which relationships depends on the problem you are investigating, but once you set it up you can simply re-run the same View and refresh your JSON dataset with new elements.
- With the Tulip library loaded into Python, the same script can also compute network metrics and visualize the graph.
- The script’s output can be visualized as a web page, through a standard web server. A library such as sigma.js can take care of visualizing the graph.
The number crunching can be done server-side in just one stop. The Python script calls a curl of the Drupal view, and loads the JSON dataset. Then it does the parsing, the building of the network and the computing of network metrics (and possibly non-network metrics too, which is another thing I am working on now. More on this in forthcoming posts) in just one pass. It then passes the results to a web server for packaging into a dashboard of some kind and some pretty visuals (many networks are beautiful!).
To be fair, Python + Tulip is not the only solution. Gephi is available as a Java library (known as “the toolkit” to Gephi enthusiasts), so you could build a similar workflow with Java + Gephi. I chose Python + Tulip because I can now do a little Python (and absolutely no Java) and because Guy Melançon, Benjamin Renoust, Bruno Pinaud, Marie-Luce Viaud at University of Bordeaux and INRIA are such great collaborators. They like Tulip and I like them, so Tulip it is 🙂
