Category Archives: default (en)

Photo credit: Gerald Grote on flickr.com

World without marketing: the hacker utopia of 31C3

31C3 was my first-ever Chaos Communication Congress. If you have never come across it, CCC (or “the Congress” – Wikipedia) is Europe’s largest and most venerable hacker conference, organized since 1984 by the Chaos Computer Club, which in turn is Europe’s oldest and largest hackers association (founded 1981). It is estimated that 12,000 people participated in it. Like everyone else, I absolutely loved it. So many things made me and my fellow travelers (I participated in the Edgeryders assembly) feel welcome, at home and in awe at the same time:

  1. The intellectual firepower. These guys will gladly crowd a lecture on elliptical curve cryptography at 10.00 pm on a Saturday night, then head off to a session on how to design antenna arrays based on Maxwell’s field equations right after.
  2. The playful, take-no-prisoners attitude. You have to love the way the CCC crowd plays with technology, science, philosophy and their own bodies: it’s no holds barred. DJs all night long; the guy 3D printing colorful dildos (by night he plugged the printer next to the dancefloor. I wonder if that was a pickup line?); the internal pneumatic-tube messaging system cheekily nicknamed SeidenStrasse (Silk Road), which is hardly necessary for a conference that boasts having more Internet users and bandwidth than North Korea, but is (apparently) fun to build it, just because you can. The amount of human labor and ingenuity that goes into building stuff that has absolutely no purpose other than being “cool” or “fun” is bewildering. Fun is very serious for this crowd – these are people that will cheerfully dig trenches to lay optic fiber so they get faster Internet at their summer camps.
  3. The wild wild diversity. People from every walk of life showed up to engage in every kind of activity, and there seemed to be a place for everyone (certainly there were toilets for many kinds of creatures). From meditation to bondage workshops from beginners, from gaming to math, from lockpicking to metalworking, from cryptography to cooking. We hanged out a lot with our new friends of Food Hacking Base, who sported some pretty impressive DIY kitchen appliances – and used them to prepare tasty “wormburgers”, based on dried insect larvae. Yum!
  4. The generosity. Most people are at CCC to give something to the community. All workshops I know of were free. You are charged to get in, but 100 EUR is not much for a four-day conference of such a stellar level – I doubt there is much profit in it. Food Hacking Base gave delicious food, free of charge, to anybody who showed up, at any time of the day or of the night.

In the small hours of the third day, when the party was in full swing (with most people dancing, but a few diehards coding away on their laptops, two meters from the dancefloor), it finally hit home: I had not seen a single advertisement in the whole conference (if you don’t count laptop stickers). 31C3 is the most marketing-free public space I have ever been in throughout my entire adult life – OK, except the small, radical events like Living On The Edge, but those are a hundred times smaller. It felt just great to be in a social space, enjoying the company of others, with no pressure whatsoever to buy stuff so that you can conform to some ideal archetype.

It cannot be easy for the CCC crowd to keep marketeers out of their space. Why do they do it? Do they not need money? With 12,000 people with disposable income, companies must be salivating to brand the Congress.

I suspect there might be a connection between the freedom and creativity of CCC and its disdain of marketing. With the desire machine turned off, the pressure to conform to the rich and beautiful people in the commercials goes away. We get extra space in our brain, which we can reallocate to the full range of crazy stuff we, as a society, are actually interested in. All in all, CCC feels much like the early Internet, where indeed commercial activities were forbidden until 1995.

Don’t get me wrong: I have many friends that work in marketing. I don’t mean to invoke a prejudice against the whole discipline. But, after the taste of a world without marketing in CCC, I wonder how, exactly, that discipline is contributing to the advancement of humanity, and if we would not be better without it.

Photo credit: Gerald Grote on flickr.com

Looking for the mathematical signature of engagement policies in online communities

(Disclaimer: this is very very preliminary, a far cry from a publishable result. I am doing open notebook science here, in case some genius out there has some useful suggestion!)

Evolution of networks of online conversations

A growing literature on evolving networks finds that degree distributions of a great many real world networks follow power laws (survey article). The mathematical explanation goes more or less as follows: if a network grows according to a mechanism that has some preferential attachment in it (for example: M new links are generated at each period, of which N connect to existing nodes at random and M-N connect to existing nodes by preferential attachment), this network will end up with a pure power law degree distribution. The presence of non-preferential attachment components in the growth mechanism will affect the exponent of the power law, but not the shape of the distribution itself.

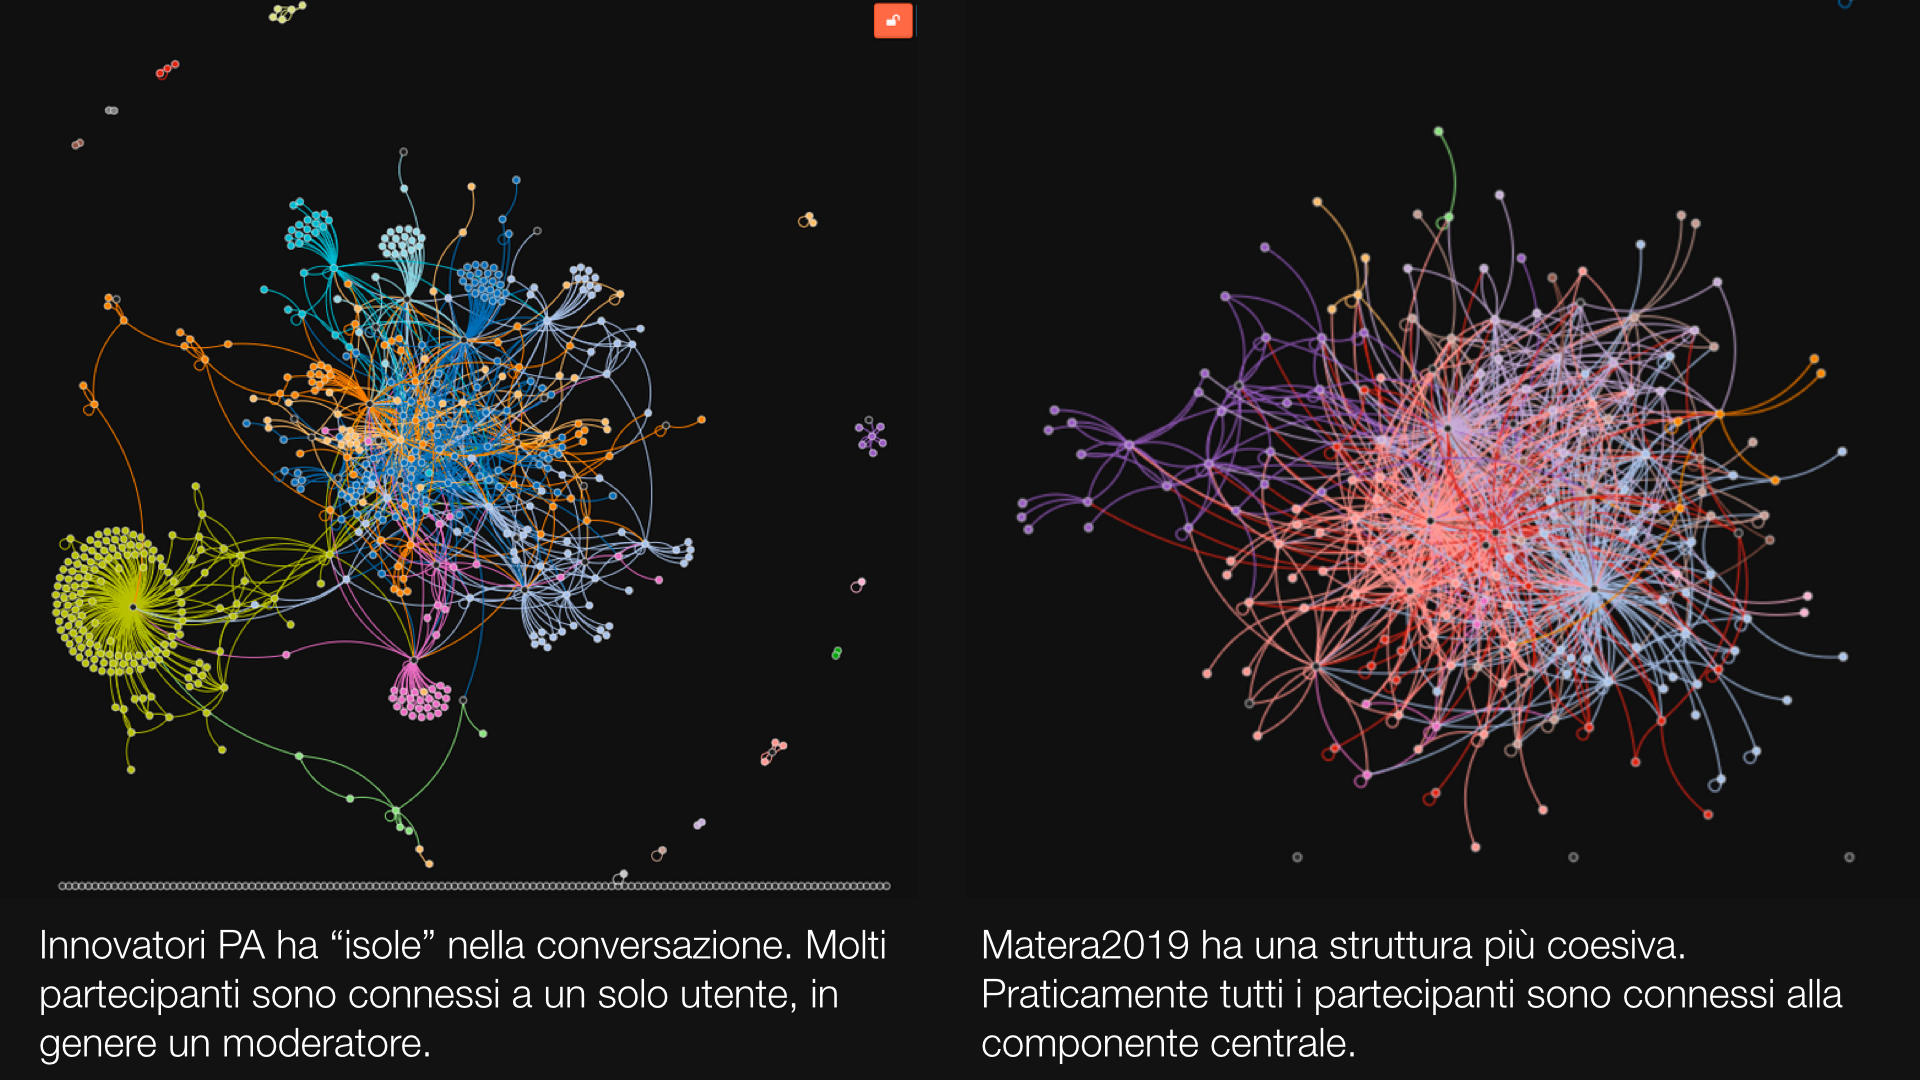
It seems reasonable that there should be at least some preferential attachment in online conversation networks. As new members join, many of them will reach out to someone, and it seems to make sense that they will target highly connected individuals more. So, we should expect online conversation networks to display a power law degree distribution. On the other hand, in the course of testing Edgesense, it became apparent that the conversation networks different online communities have very different topologies:

Edgesense_comparison.001

Methodology

Anecdotically, these two communities differ by many things, but I am especially interested in moderation policies. Innovatori PA (left) has no special moderation policy; different people are responsible for what they call “communities” (the database sees them as groups), and each of them does what feels appropriate. Matera 2019 (right) is run as per a relatively tight “no user left behind” policy: moderators are instructed to go comment each and every new user. I can’t prove directly that the moderation policy is responsible for the difference in network shape (I have no counterfactual), but what I can do is the following:

  1. Test that the degree distribution of a moderated conversation does NOT follow a power law.
  2. Make an educated guess as to how the policy is expected to “distort” the degree distribution. For example, the idea behind “no user left behind” is that users who get comments by moderators will become more active, leaving more comments than they would otherwise do (I already confirmed this by panel data econometric techniques). More comments translate into more edges in the network. Since this policy only applies to new members (established members do not need encouragement to take part in the conversation). we expect it to influence only low-degree nodes.
  3. If the network’s degree distribution does not follow a power law, we know that some mechanism is at work, and it is so much stronger than preferential attachment as to drown it into noise. If the educated guess is also confirmed, we have an indication that the policy might be responsible for it – but not a proof that it is.

I test this with the Edgeryders conversation network. On November 10th, 2014, Edgeryders had 596 active users (“active” in the sense of having authored at least one post or comment); just over 3,000 posts; and over 12,000 comments. Comments induce edges: Anna is connected to Bob if she has commented at least one of Bob’s posts or comments (comments are threaded in Edgeryders, so users can comment other users’s comments). The induced network is directed and weighted, with 596 nodes and 4,073 edges.

My educated guess is as follows:

  1. Fewer nodes have degree 0. These would be users that become active with a post (they are not commenting anyone with their first action in the community); the policy says these should be commented, and if they are they should have degree 1.
  2. Fewer nodes have degree 1. These would be users who become active with a comment, and therefore they have degree 1 upon appearance in the community. At that point, one of the moderators would comment them, therefore pushing their degree up to 2.
  3. Both these effects would be compounded, with some probability, by the finding that people who receive comments tend to become more active. So, you would expect to see some users that would have degree 0 or 1 in a non-moderated community be pushed not only to degree 1 and 2 respectively, but to a degree greater than 2. So, we expect more users to have a minimum degree n equal to or greater than 2 and above than in a non-moderated (but otherwise identical) online community. The value of n depends on how well the policy works in prompting users to get more active: if it works well enough, n could be 3, 4, or even more. This situation produces a “hump” at in the expected empirical degree distribution with respect to the theoretical pure power law one.
  4. We also expect this hump to level off. As users become active members of the community, they are no longer the object of special attention by moderators. At this point, they become subject to the usual dynamics of preferential attachment, or whatever dynamics really regulate the growth of an online conversation.
  5. If effective, this policy also makes moderators very highly connected. This effect is trivial for out-degree, but we should observe it for in-degree too, as some of the connections moderators make to new users will be reciprocated.

Findings

I use Jeff Alstott’s Power Law Python package to examine the distribution and follow’s Alstott method of testing comparative goodness-of-fit across alternate distributions. The results are as follows.

The power law distribution does not seem like a good fit for the whole dataset. This conclusion holds across in-degree, out-degree and in- and out-degree distributions. In what follows I focus on the in-degree distribution, because it is the one where preferential attachment seems most likely to exert a strong influence. I do not drop moderators, because users cannot influence their own in-degree (except for self-loops, which I drop from the data, reducing the number of edges to 3903); this allows me to test also for item 5 in the previous list. In-degree in the data so reduced varies from 0 to 234.

However, when we fit a power law distribution only to the curve describing nodes with degree 4 or above, we find a much better fit. Cutting the curve at degree 4 minimizes the Kolmogorov-Smirnov distance between the fitted line and the data.

Following Alstott’s recommendations, I tested the goodness-of-fit of the power law distributions against two alternative candidate distributions: the exponential and the lognormal. Testing against an exponential has the sense of testing whether the empirical distribution is heavy-tailed at all: the exponential having a better fit than the power law would indicate little support in the data for preferential attachment as a growth mechanism of the network. Testing against a lognormal is a successive step: once it has been determined that the empirical data indeed follow a fat-tailed distribution – a clear superiority of the power law’s fit would indicate strong support for the preferential attachment hypothesis. Unfortunately, this does not go two ways: a superior lognormal fit by itself would probably not be enough to reject the preferential attachment hypothesis (it is famously difficult to tell these two distributions apart. The controversy on lognormal vs. power law distributions of real world networks started immediately after Barabasi and Albert’s 2005 Nature article.)

Here are the results. Statistical significance is highlighted in blue and given as p-values (0.01 means 99% significance). 

Whole dataset  
Exponential Lognormal
Power law vs. Exponential (0.604) Lognormal (1.25 x 10⁻¹⁸)
Exponential vs.  //  Lognormal (0.024)
Degree >= 4  
Exponential Lognormal
Power law vs. Power law (0.004) Lognormal (0.268)
Exponential vs.  //  Lognormal (0.002)

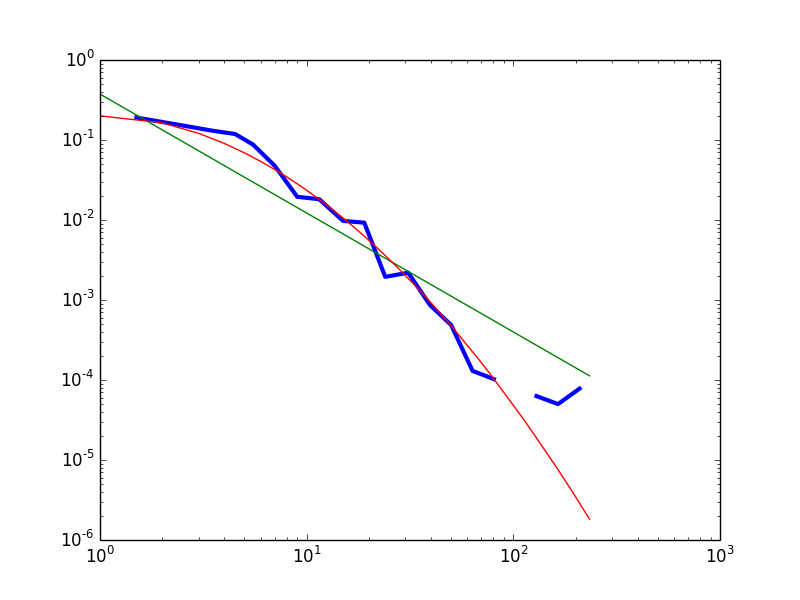
Fig.1 – The empirical data (blue) compared with a fitted power law (green) and lognormal (red) distributions. The best fit exponential is not reported because it drops much faster in the tails, and so makes the rest of the picture unreadable.

Provisionally, I conclude that the data do carry some support for the distribution to be heavy-tailed. However, a power law is not a good fit for the left part of the distribution. 

The “hump” in the head of the distribution seems indeed to be present. Visual inspection of the whole dataset’s empirical distribution (degree >= 1) reveals that the power law distribution overestimates the frequency of nodes with degree 1; underestimates the frequency of nodes with degree 2 to 25; then overestimates the frequency of highly connected nodes (inDegree > 25). The “hump” is less pronounced, but still there, with respect to the best fit lognormal: the lognormal slightly overestimates the correctly frequency of nodes with degree 1 and 2; underestimates the frequency of nodes with degree 3 to 7; then predicts correctly enough the frequencies of nodes with degree 8 to 80; then underestimates the heaviness of the tail.

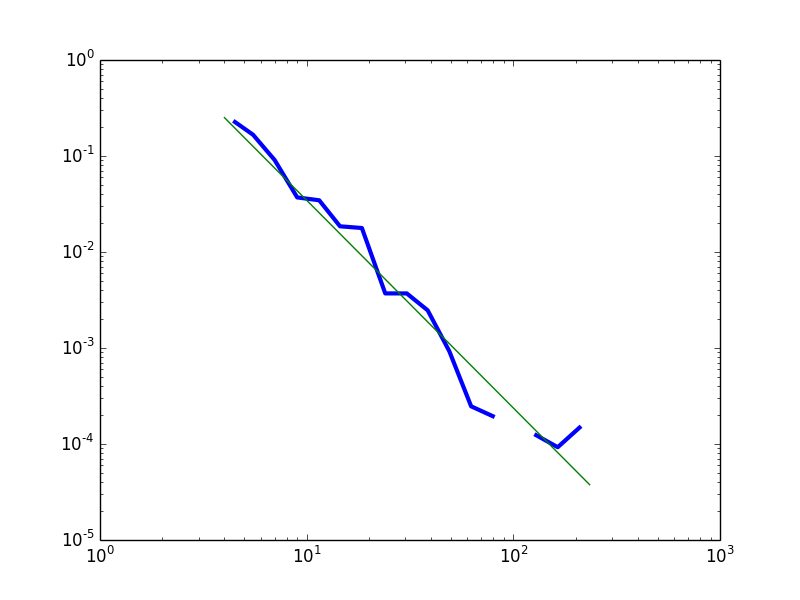
An alternative approach is to consider the distribution as a power law with noise in the head and in the tail. In Figure 2 I plot the empirical frequency density curve for degree >= 4 against the best-fit power law distribution. This has the advantage of not requiring ad hoc arguments to justify the choice of a lognormal as the distribution of choice (it might appear we are overfitting).

In both cases, we can conclude that the data are compatible with the theoretical prediction of a power law distribution, except for very low values of the degree variable. The moderation policy followed in Edgeryders aims to make being weakly connected a temporary condition, by encouraging users to get more deeply involved in the conversation – and therefore more strongly connected. Weakly connected nodes can be interpreted either as new users, on their way to acquiring more links, or as “fossiles” – users on which the policy did not work.

Edgeryders_powerlaw_XMin4

Fig.2 – The empirical data (blue) compared with a fitted power law (green) for degree >= 4.

How to make progress?

This is an encouraging first pass on the data, but I would like to “harden” the testing. Is there a way to mathematically predict the precise shape of the degree distribution for low degrees, based on the policy and the generic prediction of a power law distribution. Does anyone have any suggestions?

Algorithmic detection of specialization in online conversations

This is a writeup of the Team 1 hackathon at Masters of Networks 2. Participants were: Benjamin Renoust, Khatuna Sandroshvili, Luca Mearelli, Federico Bo, Gaia Marcus, Kei Kreutler, Jonne Catshoek and myself. I promise you it was great fun!

The goal

We would like to learn whether groups of users in Edgeryders are self-organizing in specialized conversations, in which (a) people gravitate towards one or two topics, rather than spreading their participation effort across all topics, and (b) the people that gravitate towards a certain topic also gravitate towards each other.

Why is this relevant?

Understanding social network dynamics and learning to see the pattern of their infrastructure can become a useful tool for policy makers to rethink the way policies are developed and implemented. Furthermore, it could ensure that policies reflect both needs and possible solutions put forward by people themselves. The ability to decode linkages between members of social networks based on the areas of their specialization can allow decision makers and development organisations to:

  1. Tap into existing networks of knowledge and expertise to gain increased understanding of a policy issue and of the groups most affected (i.e. the target population of a policy)
  2. Identify pre-existing bottom-up (ideas for) solutions relevant to the policy issue at hand
  3. Bring together networks with a proven interest in a policy issue and leverage their engagement to design new solutions and bring about change

Compared to traditional models of policy development, this method can allow for more effective and accountable policy interventions. Rather than spending considerable resources on developing a knowledge base and building new communities around a policy theme, the methodology would enable decision makers and development organisations alike to tap into available knowledge bases and to work with these existing networks of interested specialists, saving time and resources. Moreover, pre-existing networks of specialists are expected to be more sustainable as a resource of information and collective action than ad-hoc networks built around emerging policy issues.

The data

Edgeryders is a project rolled out by the Council of Europe and the European Commission in late 2011. Its goal was to generate a proposal for the reform of European youth policy that encoded the point of view of youth themselves. This was done by launching an open conversation on an online platform (more information).

The conversation was hosted on a Drupal 6 platform. Using a Drupal module called Views Datasource, we exported three JSON files encoding respectively information about users; posts; and comments.
These data are sufficient to build the social network of the conversation. In it, users represent nodes; comments represent edges. Anna and Bob are connected by an edge if Anna has written at least one comment to a piece of content authored by Bob. We used a Python script with the Tulip library for network analysis to build the graph and analyze it. The result was a network with 260 active people and about 1600 directed edges, encoding about 4000 comments.

To move towards our goal, we needed to enrich this dataset with extra information concerning the semantics of that conversation (see below).

What we did

To define the extent to which degree people gravitate towards certain topics, and towards each other, we carried out “entanglement analysis” on a dataset containing all conversations carried out between members of the Edgeryders network. Entanglement analysis was proposed by Benjamin Renoust in 2013; we performed it using a program called Data Detangler (accessible at http://tulipposy.labri.fr:31497/).

1. Understanding Edgeryders as a social network of comments

These data can be interpreted as a social network: people write posts and comment on them; moreover, they can comment other people’s comments. Within this dataset, each comment can be interpreted as an edge, connecting the author of the comment to the author of the post or comment she is commenting on. Alternatively, we could interpret them as a bipartite network that connects people to content: comments are edges that connect their authors to the unit of content they are commenting.

2. Posts are written in response to briefs

Each of the posts written on Edgeryders is a response to set briefs, or missons, that sit under higher level campaigns. This means that many posts – and associated comments – live under the higher level ‘topic’ of one of nine campaigns.

3. Keywords indexing briefs

In order to understand how the various topics and briefs connect to each other we analysed the keywords that defined each mission/brief. This was carried out by manually analysing the significance of word frequency for each post. Word Frequency was ascertained by using the in-browser software http://tagcrowd.com/faq.html#whatis to work out the top 12-15 words per mission. We then manually verified these words and kept those that are semantically relevant (removing, for example names, or words that were too general, or that were a function of the Edgeryders platform itself- e.g. ‘comment’ or ‘add post’).

The combination of these three elements gives us a multiplex social network, that is indexed by keywords. A multiplex social network is one where there are multiple relations among the same set of actor. The process can be visualized in Figure 1.
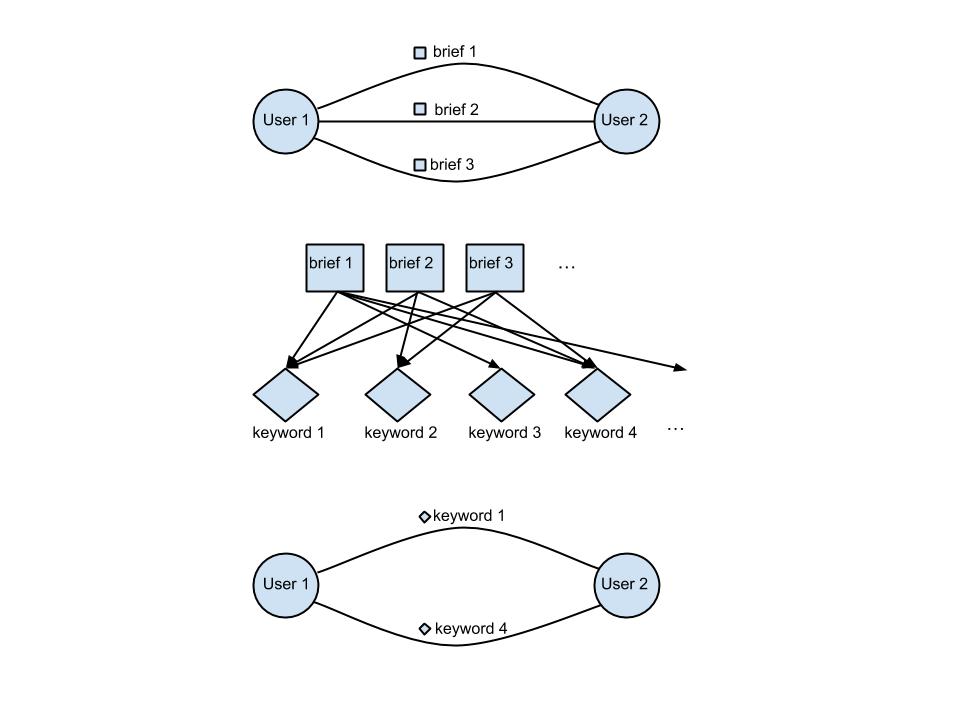
Fig. 1 – Building a multiplex  social network where edges carry semantics. Fig. 1 – Building a multiplex social network where edges carry semantics.

4. Drop one-off interactions

We dropped edges that are linked to only one brief. These are edges of  “degenerate specialistic” interactions; as they only interact in the context of one brief, they are specialistic only by default.

5. Remove generalist conversations

At this point, we had a multiplex social network of users and keywords. Users were connected by edges carrying different keywords – indeed, each keyword can be seen as a “layer” of the multiplex network, inducing its own social network: the network of the conversation about employment, the network of the conversation about education etc. Many of the interactions going on are non-specialized; the same two users talk of several different things. In order to isolate specialized conversation, for each individual edge of the multiplex we remove all keywords except those that appear in all interactions between these two users. In other words, we rebuild the network by assigning to each edge the intersection of the sets of keywords encoded in each of the individual interactions. In many cases, the intersection is empty: it only takes two interactions happening in the context of two briefs with no keywords in common for this to happen. In this case, the edge is dropped altogether.

A nice side-effect of 4 and 5 is to greatly reduce the influence of the Edgeryders team of moderators on the results. Moderators are among the most active users; while this is as it should be, they tend to “skew” the behaviour of the online community. However, 4 removes all the one-off interactions they tend to have with users that are not very active; and 5 removes all the edges connecting moderators to each other, because they – by virtue of being very active – interact with one another across many different briefs, and as a result the intersection of keywords across all their interactions tends to be zero.

6. Look for groups of specialists

We then identified groups of specialists by identifying those users interacting together solely around a small number of keywords (e.g. in example, n(keywords) = 2).
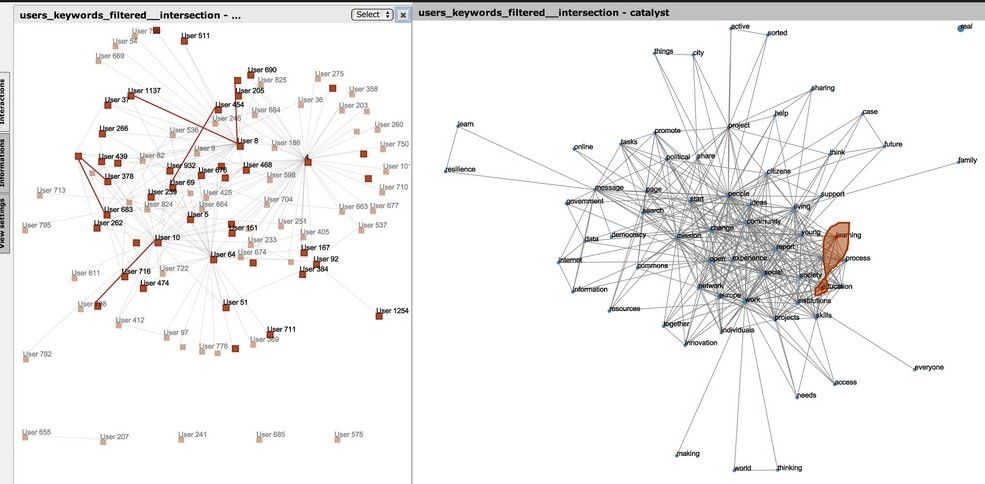
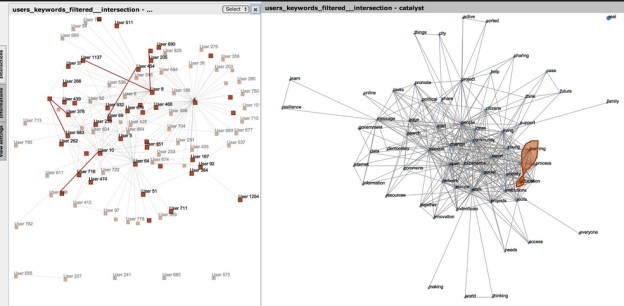
Figure 1. Specialized conversations on education and learning Figure 1. Detecting specialized conversations on education and learning.

Conclusions

The method does indeed seem to be able to identify groups of specialists. “Groups” is used here in the social sense of a collection of people that not only write content related to the keywords, but interact with one another in doing so – this is to capture the collective intelligence dimension of large scale conversations. Figure 1 shows some conversations between people (highlighted on the left) that only interact on the “education” and “learning” keywords (shown on the right). Highlighted individuals that are not connected to any highlighted edges are users who do write contributions that are related to those keywords, but are not part to specialized interactions on those keywords.

Once a group of specialists is identified, the next step is to look for the keywords that co-occur on the edges connecting them. An example of this is Figure 2, that shows the keywords co-occurring on the edges of the conversations involving our specialist group on education and learning. The size of the edge on the right part of the figure indicated that keyword’s contribution to entanglement, i.e. to making that group of keywords a cohesive one. Unsurprisingly, “education” and “learning” are among the most important ones. More interestingly, there is another keyword that seems to be deeply entangled with these two: it is “open”. We can interpret this as follows: specialized interaction on education and learning is deeply entangled with the notion of “open”. The education specialists in this community think that openness is important when talking about education.
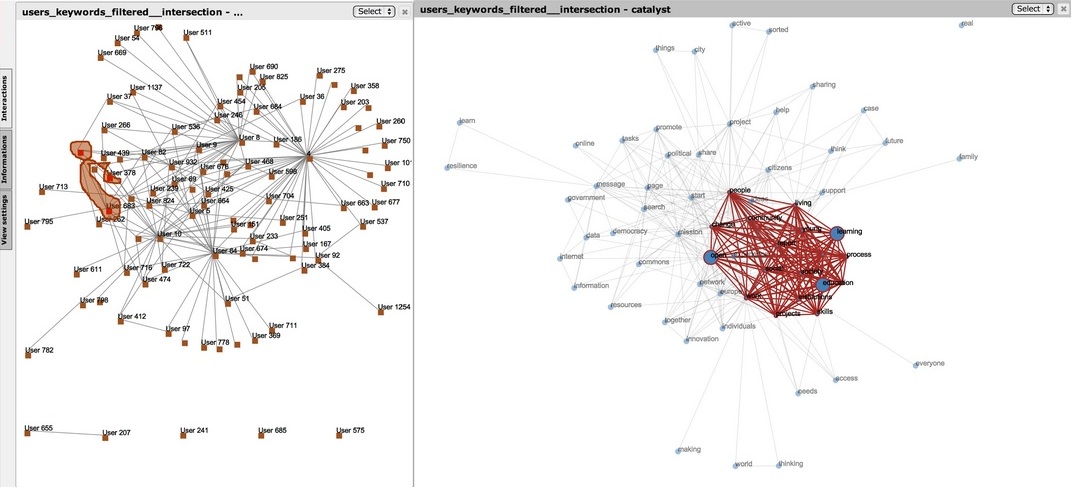
MoN2_Fig_2 Figure 3. Discovering more keywords entangled with the original two in the specialized conversation.

This method is clearly scalable. It can be used to identify “surprising” patterns of entanglement, which can then be further investigated by qualitative research.

Scope for improvement

The main problem with our method was that is is quite sensitive to the coding by keyword. Assigning the keywords was done by way of a quick hack based on occurrency count. This method should work much better with proper ethnographic coding. Note that folksonomies (unstructured tagging) typically won’t work, as it will introduce a lot of noise in the system (for example, with no stemming you get a lot of false (“degenerate”) specialist.)