(Disclaimer: this is very very preliminary, a far cry from a publishable result. I am doing open notebook science here, in case some genius out there has some useful suggestion!)
Evolution of networks of online conversations
A growing literature on evolving networks finds that degree distributions of a great many real world networks follow power laws (survey article). The mathematical explanation goes more or less as follows: if a network grows according to a mechanism that has some preferential attachment in it (for example: M new links are generated at each period, of which N connect to existing nodes at random and M-N connect to existing nodes by preferential attachment), this network will end up with a pure power law degree distribution. The presence of non-preferential attachment components in the growth mechanism will affect the exponent of the power law, but not the shape of the distribution itself.
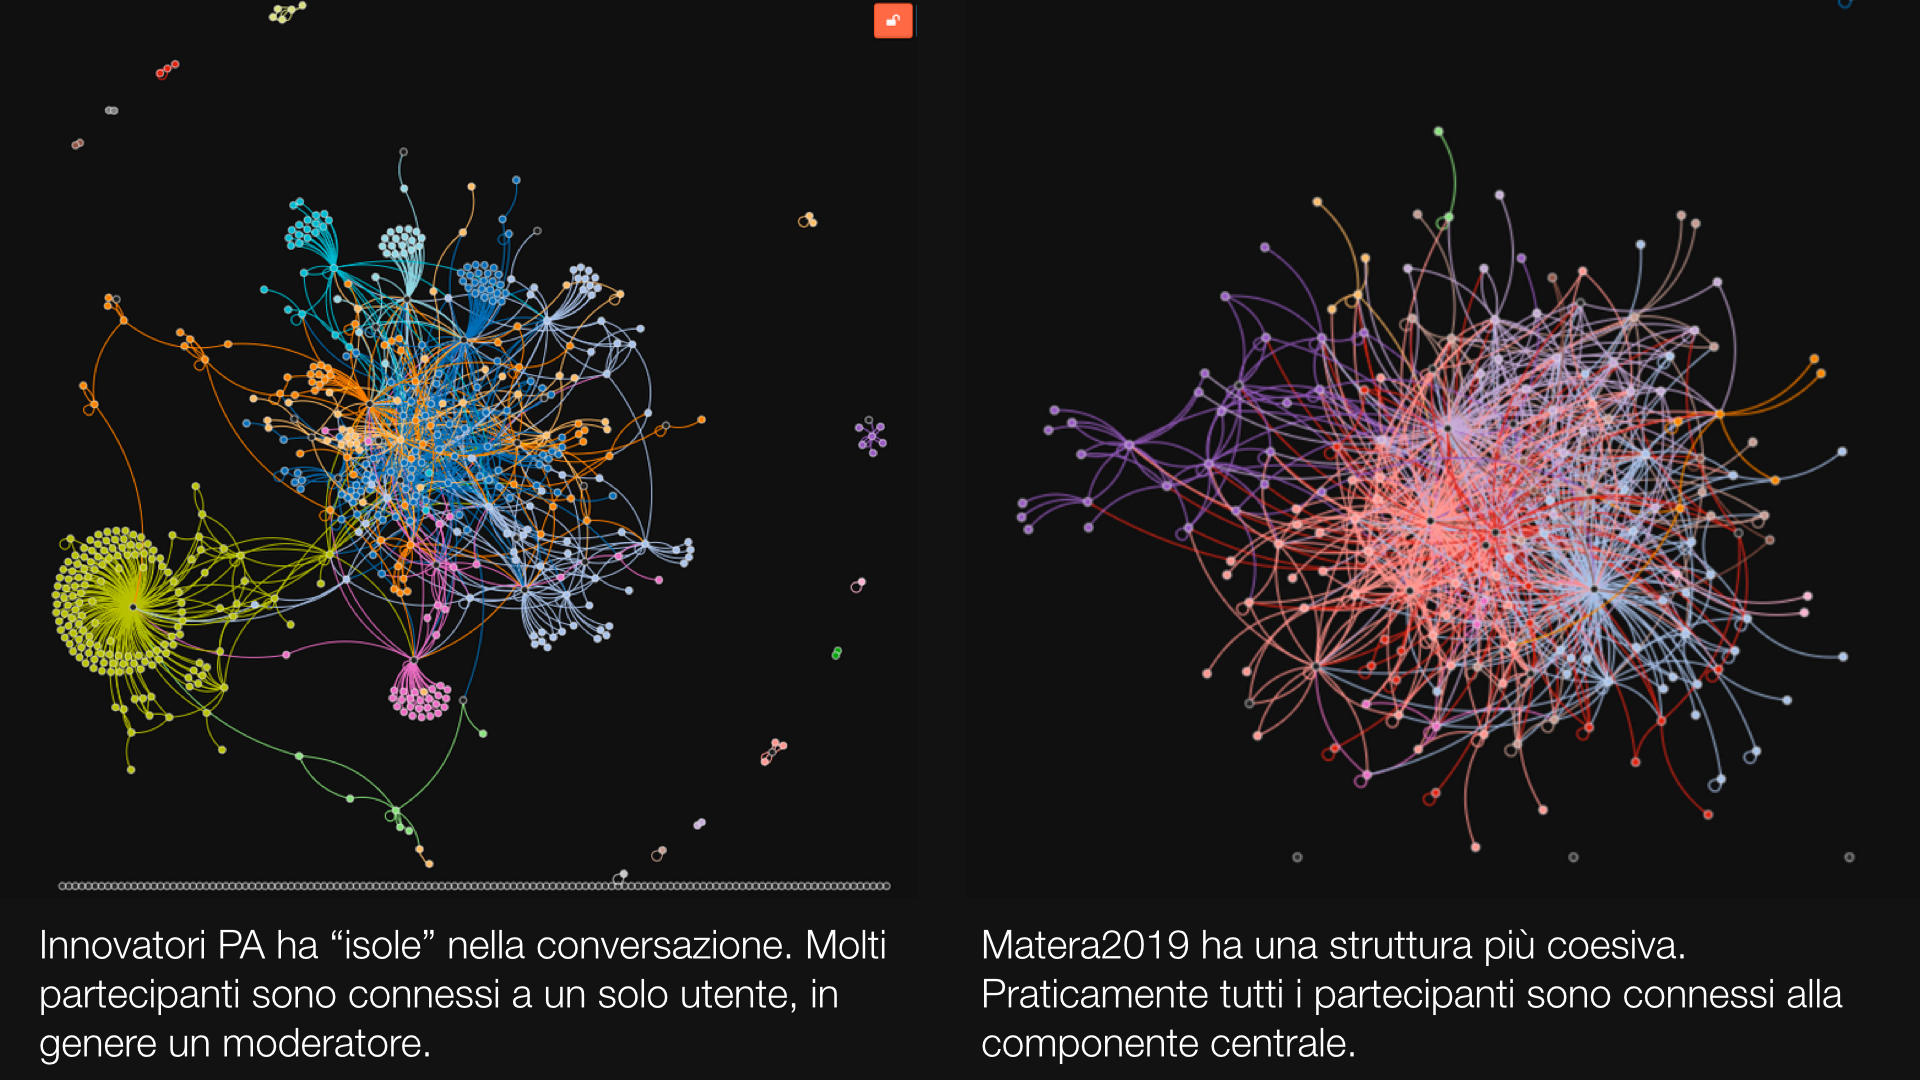
It seems reasonable that there should be at least some preferential attachment in online conversation networks. As new members join, many of them will reach out to someone, and it seems to make sense that they will target highly connected individuals more. So, we should expect online conversation networks to display a power law degree distribution. On the other hand, in the course of testing Edgesense, it became apparent that the conversation networks different online communities have very different topologies:
Methodology
Anecdotically, these two communities differ by many things, but I am especially interested in moderation policies. Innovatori PA (left) has no special moderation policy; different people are responsible for what they call “communities” (the database sees them as groups), and each of them does what feels appropriate. Matera 2019 (right) is run as per a relatively tight “no user left behind” policy: moderators are instructed to go comment each and every new user. I can’t prove directly that the moderation policy is responsible for the difference in network shape (I have no counterfactual), but what I can do is the following:
- Test that the degree distribution of a moderated conversation does NOT follow a power law.
- Make an educated guess as to how the policy is expected to “distort” the degree distribution. For example, the idea behind “no user left behind” is that users who get comments by moderators will become more active, leaving more comments than they would otherwise do (I already confirmed this by panel data econometric techniques). More comments translate into more edges in the network. Since this policy only applies to new members (established members do not need encouragement to take part in the conversation). we expect it to influence only low-degree nodes.
- If the network’s degree distribution does not follow a power law, we know that some mechanism is at work, and it is so much stronger than preferential attachment as to drown it into noise. If the educated guess is also confirmed, we have an indication that the policy might be responsible for it – but not a proof that it is.
I test this with the Edgeryders conversation network. On November 10th, 2014, Edgeryders had 596 active users (“active” in the sense of having authored at least one post or comment); just over 3,000 posts; and over 12,000 comments. Comments induce edges: Anna is connected to Bob if she has commented at least one of Bob’s posts or comments (comments are threaded in Edgeryders, so users can comment other users’s comments). The induced network is directed and weighted, with 596 nodes and 4,073 edges.
My educated guess is as follows:
- Fewer nodes have degree 0. These would be users that become active with a post (they are not commenting anyone with their first action in the community); the policy says these should be commented, and if they are they should have degree 1.
- Fewer nodes have degree 1. These would be users who become active with a comment, and therefore they have degree 1 upon appearance in the community. At that point, one of the moderators would comment them, therefore pushing their degree up to 2.
- Both these effects would be compounded, with some probability, by the finding that people who receive comments tend to become more active. So, you would expect to see some users that would have degree 0 or 1 in a non-moderated community be pushed not only to degree 1 and 2 respectively, but to a degree greater than 2. So, we expect more users to have a minimum degree n equal to or greater than 2 and above than in a non-moderated (but otherwise identical) online community. The value of n depends on how well the policy works in prompting users to get more active: if it works well enough, n could be 3, 4, or even more. This situation produces a “hump” at n in the expected empirical degree distribution with respect to the theoretical pure power law one.
- We also expect this hump to level off. As users become active members of the community, they are no longer the object of special attention by moderators. At this point, they become subject to the usual dynamics of preferential attachment, or whatever dynamics really regulate the growth of an online conversation.
- If effective, this policy also makes moderators very highly connected. This effect is trivial for out-degree, but we should observe it for in-degree too, as some of the connections moderators make to new users will be reciprocated.
Findings
I use Jeff Alstott’s Power Law Python package to examine the distribution and follow’s Alstott method of testing comparative goodness-of-fit across alternate distributions. The results are as follows.
The power law distribution does not seem like a good fit for the whole dataset. This conclusion holds across in-degree, out-degree and in- and out-degree distributions. In what follows I focus on the in-degree distribution, because it is the one where preferential attachment seems most likely to exert a strong influence. I do not drop moderators, because users cannot influence their own in-degree (except for self-loops, which I drop from the data, reducing the number of edges to 3903); this allows me to test also for item 5 in the previous list. In-degree in the data so reduced varies from 0 to 234.
However, when we fit a power law distribution only to the curve describing nodes with degree 4 or above, we find a much better fit. Cutting the curve at degree 4 minimizes the Kolmogorov-Smirnov distance between the fitted line and the data.
Following Alstott’s recommendations, I tested the goodness-of-fit of the power law distributions against two alternative candidate distributions: the exponential and the lognormal. Testing against an exponential has the sense of testing whether the empirical distribution is heavy-tailed at all: the exponential having a better fit than the power law would indicate little support in the data for preferential attachment as a growth mechanism of the network. Testing against a lognormal is a successive step: once it has been determined that the empirical data indeed follow a fat-tailed distribution – a clear superiority of the power law’s fit would indicate strong support for the preferential attachment hypothesis. Unfortunately, this does not go two ways: a superior lognormal fit by itself would probably not be enough to reject the preferential attachment hypothesis (it is famously difficult to tell these two distributions apart. The controversy on lognormal vs. power law distributions of real world networks started immediately after Barabasi and Albert’s 2005 Nature article.)
Here are the results. Statistical significance is highlighted in blue and given as p-values (0.01 means 99% significance).
| Whole dataset | ||
| Exponential | Lognormal | |
| Power law vs. | Exponential (0.604) | Lognormal (1.25 x 10⁻¹⁸) |
| Exponential vs. | // | Lognormal (0.024) |
| Degree >= 4 | ||
| Exponential | Lognormal | |
| Power law vs. | Power law (0.004) | Lognormal (0.268) |
| Exponential vs. | // | Lognormal (0.002) |

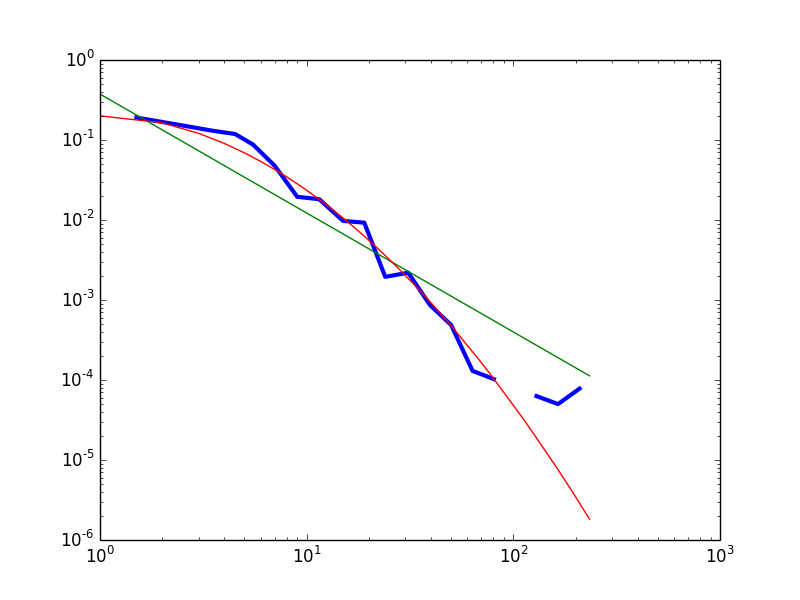
Fig.1 – The empirical data (blue) compared with a fitted power law (green) and lognormal (red) distributions. The best fit exponential is not reported because it drops much faster in the tails, and so makes the rest of the picture unreadable.
Provisionally, I conclude that the data do carry some support for the distribution to be heavy-tailed. However, a power law is not a good fit for the left part of the distribution.
The “hump” in the head of the distribution seems indeed to be present. Visual inspection of the whole dataset’s empirical distribution (degree >= 1) reveals that the power law distribution overestimates the frequency of nodes with degree 1; underestimates the frequency of nodes with degree 2 to 25; then overestimates the frequency of highly connected nodes (inDegree > 25). The “hump” is less pronounced, but still there, with respect to the best fit lognormal: the lognormal slightly overestimates the correctly frequency of nodes with degree 1 and 2; underestimates the frequency of nodes with degree 3 to 7; then predicts correctly enough the frequencies of nodes with degree 8 to 80; then underestimates the heaviness of the tail.
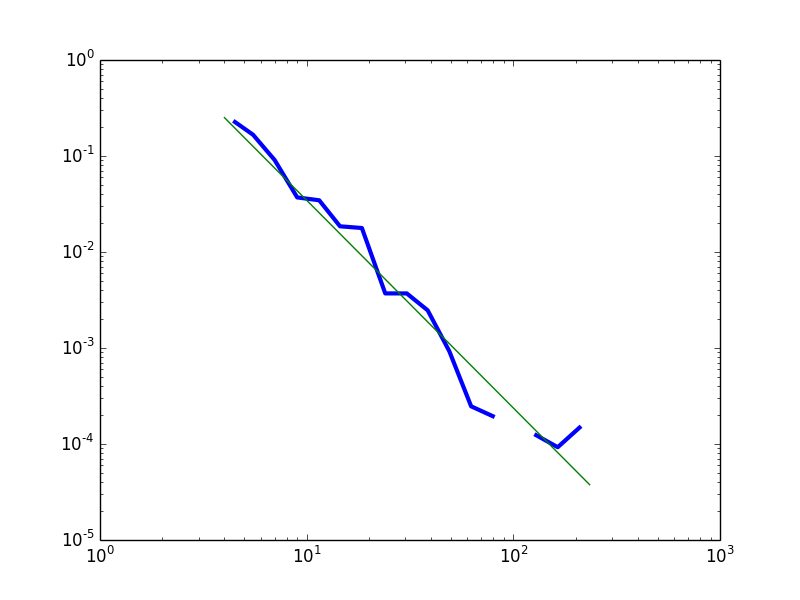
An alternative approach is to consider the distribution as a power law with noise in the head and in the tail. In Figure 2 I plot the empirical frequency density curve for degree >= 4 against the best-fit power law distribution. This has the advantage of not requiring ad hoc arguments to justify the choice of a lognormal as the distribution of choice (it might appear we are overfitting).
In both cases, we can conclude that the data are compatible with the theoretical prediction of a power law distribution, except for very low values of the degree variable. The moderation policy followed in Edgeryders aims to make being weakly connected a temporary condition, by encouraging users to get more deeply involved in the conversation – and therefore more strongly connected. Weakly connected nodes can be interpreted either as new users, on their way to acquiring more links, or as “fossiles” – users on which the policy did not work.
How to make progress?
This is an encouraging first pass on the data, but I would like to “harden” the testing. Is there a way to mathematically predict the precise shape of the degree distribution for low degrees, based on the policy and the generic prediction of a power law distribution. Does anyone have any suggestions?

